Showing posts with label Markit. Show all posts

Tuesday, September 16, 2008

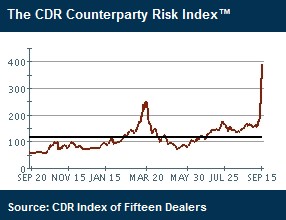
CDR Counterparty Risk Index Swamps March High

Credit Derivatives Research has a Counterparty Risk Index (and a number of related sub-indices) which calculates the average credit spread of the 15 largest credit derivative dealers. Following the recent turmoil in the credit markets, the index now stands more than 50% higher than the previous March 2008 high.

Not surprisingly, the Markit CDX (credit default swap) indices are seeing similar spikes.

[graphic courtesy of Credit Derivatives Research]

Wednesday, April 16, 2008

Measuring Stress in the System

Historically, the VIX has been an excellent proxy for measuring the level of anxiety and stress in the financial markets…but not always the best one.

Back in early March 2007, I suggested credit default swaps – and particularly the Markit indices – as a way to monitor how the markets are pricing in the risk of defaults. Another common way to monitor default risk is to look at the yield spread between corporate bonds of various rating categories versus the (presumably) riskless US Treasury debt of comparable maturity.

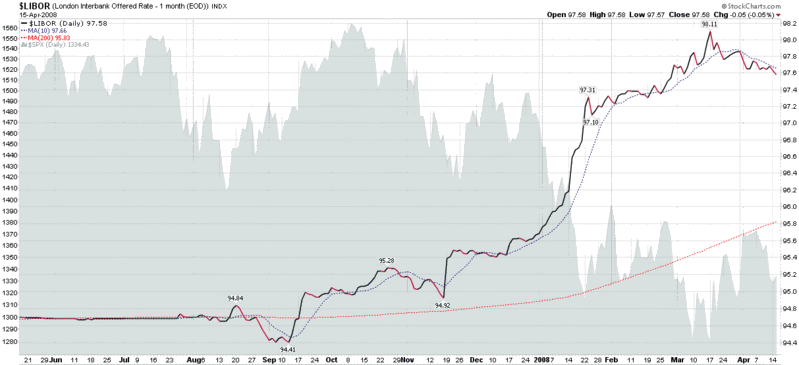
Let me nominate a third alternative: LIBOR rates. LIBOR (formally the London Interbank Offered Rate) is essentially the established rate at which banks lend to each other. Normally LIBOR rates track the Fed Funds rates fairly closely, but lately the LIBOR rates have remained elevated even as the Fed has acted to cut rates and attempted to inject liquidity into the system. If you want to get a sense of how effective the Fed has been in easing tight credit, LIBOR rates (and the "TED spread," which is the difference between LIBOR and the Fed Funds rate) are a good place to start. As the chart below shows, even though LIBOR rates may have topped a month ago, they remain quite elevated when compared to the August-December period.

For more detailed discussion of LIBOR, the Fed, and the current credit crisis, a good place to start is Michael Shedlock’s Failures of the Term Auction Facility – which is decidedly not for the faint of heart.

Monday, April 16, 2007

The Battle for Bond ETF Supremacy

Over the weekend, there was an interesting MarketWatch.com article, "In come more bond ETFs: Vanguard enters wide-open market as Barclays throws out the 'junk,'" about the battle for bond ETF supremacy between Barclays (BGI) and Vanguard, with BGI landing the first few punches. Two items in particular caught my interest:

  1. BGI's launch of the first high yield ETF, the iShares iBoxx High Yield Corporate Bond Fund (ticker HYG); and
  2. the very low 0.11% expense rates for the Vanguard bond ETFs

Specific to VIX, volatility and risk, I can see future applications involving the use of a high yield ETF with a government long bond ETF like TLT to look at ratio charts (unfortunately, StockCharts.com does not yet have HYG in their database,) price differential charts, etc. This type of analysis might turn out to be a good complement to the Markit Credit Default Swap data.

Looking more at the “…and More” side of the ledger, here are a handful of ETF-related links that I get a lot of value from:

Finally, while the bond ETF field is already getting crowded, I thought I might point out a half dozen ETFs that have consistently high volume and consequently are as appropriate for trading as they are for longer term investing:

  • SHY - iShares Lehman 1-3 Year Treasury Bond Fund
  • IEF - iShares Lehman 7-10 Year Treasury Bond Fund
  • TLT - iShares Lehman 20+ Year Treasury Bond Fund
  • AGG - iShares Lehman Aggregate Bond Fund
  • LQD - iShares iBoxx $ Invest Grade Corp Bond Fund
  • TIP - iShares Lehman TIPS Bond Fund

Thursday, March 8, 2007

The Credit Default Swap Canary

Raise your hand if you were following were watching the Bombay Sensex for clues about the future of the Chinese market or were wise to the unwinding of the Yen carry trade before it happened. Maybe you were tipped off to the subprime mortgage debacle. If so, you did a better job than most investors.

I won’t say that keeping a weather eye on the VIX would have guaranteed that you found yourself on the right side of the markets on 2/27, but it would have helped. Careful study of the equity put to call ratio would also probably have helped.

Let me nominate another canary to add to the investment coal mine: credit default swaps. I know, I’m not a bond guy either, but keeping an eye on how the markets are pricing default risk (the spread versus the US Treasury yield curve) is somewhat of a bond analog for how equity risk is priced in with the VIX.

I highly recommend watching the credit default swap index for high yield corporate bonds. A snapshot of this index is available at Yahoo, but much more information is available through Markit (click on the Dow Jones CDX.NA.HY link to pull up the graph below). Note that in the high yield graph, the market discounted 1/3 of the risk premium from September to Feburary and is now going through wild gyrations in an effort to re-price the risk premium to better match current expectations.

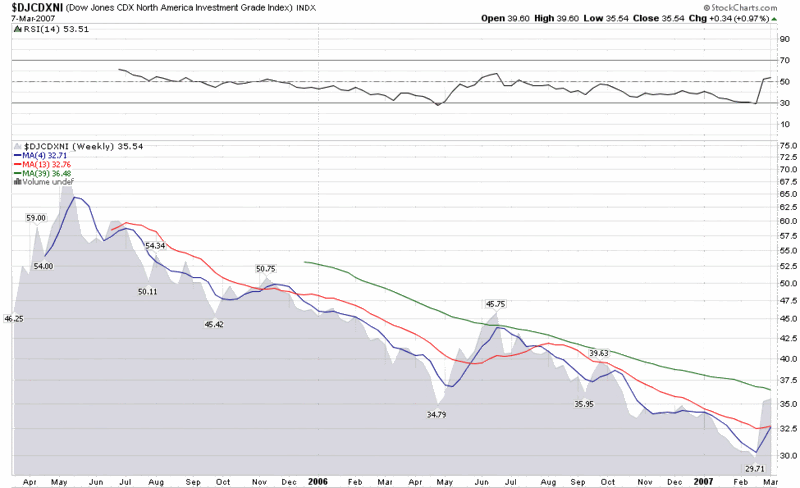
I should also note that while StockCharts.com does not provide charts for the high yield credit default index, they do offer charts for a sister index, the investment grade credit default index, whose weekly chart I have included below. The IG index chart suggests that the recent turmoil in the bond markets is less than what transpired during the May-July sell-off of last year and does little to reverse the 20 month trend of increasingly narrowing credit default spreads.
The bottom line is that it is always good to have a canary that you watch closely to help call market tops and bottoms. It can’t hurt to have several canaries, each with their own unique sensitivities.
DISCLAIMER: "VIX®" is a trademark of Chicago Board Options Exchange, Incorporated. Chicago Board Options Exchange, Incorporated is not affiliated with this website or this website's owner's or operators. CBOE assumes no responsibility for the accuracy or completeness or any other aspect of any content posted on this website by its operator or any third party. All content on this site is provided for informational and entertainment purposes only and is not intended as advice to buy or sell any securities. Stocks are difficult to trade; options are even harder. When it comes to VIX derivatives, don't fall into the trap of thinking that just because you can ride a horse, you can ride an alligator. Please do your own homework and accept full responsibility for any investment decisions you make. No content on this site can be used for commercial purposes without the prior written permission of the author. Copyright © 2007-2023 Bill Luby. All rights reserved.
 
Web Analytics