Thursday, October 9, 2008

Failure to Launch

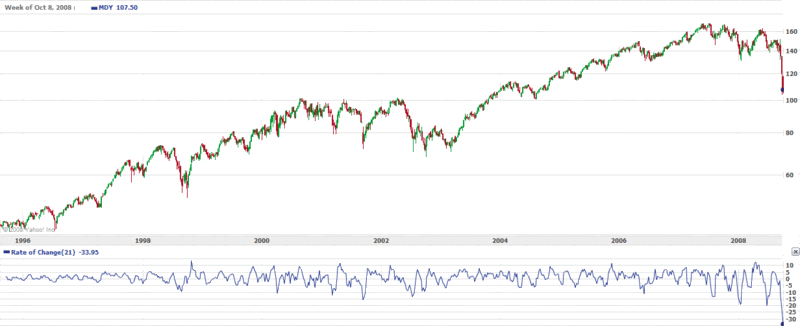
Almost all of my overbought and oversold indicators that I apply to various indices and ETFs are screaming “oversold!” at the moment. One index in particular, the S&P 400 MidCap Index, stands out among the crowd. The MidCap Index, which has an ETF that trades under the ticker MDY, has been in existence since 1995. The chart below, courtesy of Yahoo, shows the performance of that index over the past 15 years. If you are looking for an overbought/oversold indicator, the 21 day rate of change (ROC) indicator is a good one. Looking at the ROC for 2008, notice how the current readings are the third time this year that the ROC set a new record for negative ROC. Also, the current reading of -33.95 is more than double what had been seen prior to this year.

With all of the oversold extremes, there will certainly be at least a short-term bounce soon. The fact that it has not happened yet is particularly interesting and means that more rocket fuel is building up for that bounce. For now, however, the failure to launch says as much about the investor psyche as anything else. Only in a market with a VIX approaching 60, would a market be too fearful to bounce.

Sometimes it is what the markets don't do that speaks volumes...

[source: Yahoo]

Wednesday, October 8, 2008

VIX Sets Third Consecutive End of Day High

The new end of day mark is 57.53...and the official new intra-day VIX high is 59.06

For reference, the all-time high close as of two weeks ago was 45.74, making today's record a 26% increase.

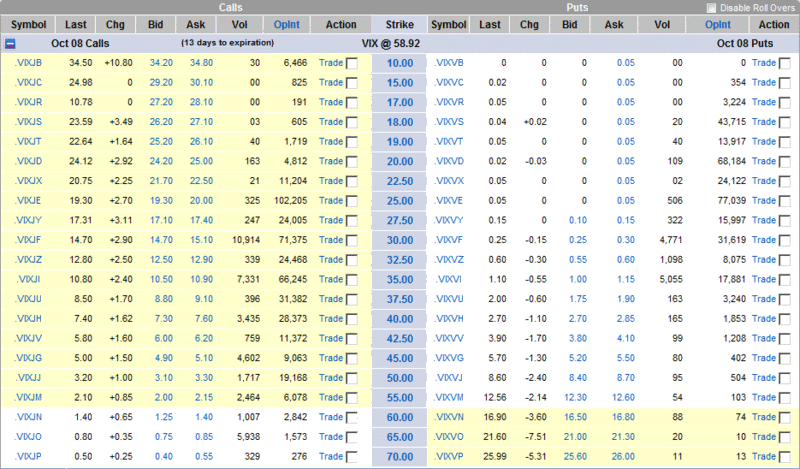
VIX October 70 Calls Last Traded at $0.50

Below I have attached a snapshot of the VIX October options, courtesy of optionsXpress, just as the VIX was making a new all-time high of 58.92. There are some amazing numbers in this table, which I am capturing here for archival purposes.

[source: StockCharts]

Yet Another VIX Record: 58.36

The VIX spike to 58.36 seem to trigger a little buying on weakness.

At this point, one of the more important trends to watch is the relative levels of buying on weakness vs. selling into strength.

A Conceptual Framework for Volatility Events

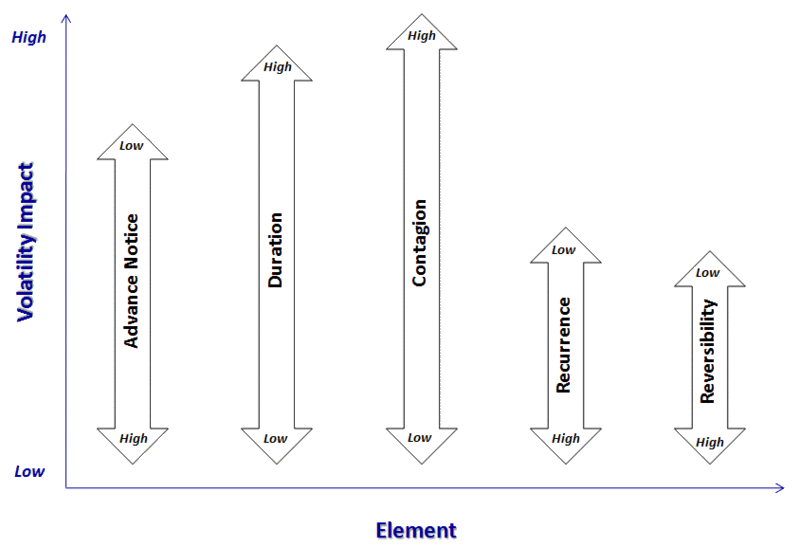
I developed a framework to aid in thinking about volatility events awhile back and given the recent volatility, I thought it might be helpful to share that framework.

First, there are many different types of events that affect volatility. Some of these events transpire almost instantaneously according to an exact timetable that is known in advance, even if the facts are a surprise. Examples of exact-instantaneous volatility events include government economic data (e.g., tomorrow’s weekly jobless claims), corporate earnings announcements (e.g., Chevron (CVX) reports tomorrow), and yesterday's speech by Ben Bernanke. Other events unfold incrementally on a fuzzy timetable, with any number of twists and turns. Examples of fuzzy-incremental events include hurricanes (Gustav, Hanna, etc.), geopolitical crises (Georgia/South Ossetia, Iran, Iraq, etc.), and of course, the current financial crisis.

Contagion is an important aspect of volatility events. Will the event spread and trigger other related high volatility events? Sector contagion (institutional interconnectedness in the financial sector) and geographical contagion (the Asian financial crisis) are relatively common, but entity-specific problems (e.g., Enron) generally do not spread to encompass an entire sector (though they might hint at a broader previously unrecognized sector problem.)

Without diving into too much detail in this space, I will mention two other related elements of a conceptual framework for volatility events: recurrence and reversibility. Government data reports are recurring and reversible. Productivity and GDP numbers are released quarterly and are subsequently revised. FOMC announcements and same store sales numbers are recurring, but are not revised. Fuzzy-incremental volatility events are not recurring (in identical form) and are not reversible. Legal rulings, however, are not recurring and are reversible.

So what does this all mean? It means that most volatility events can be classified along five dimensions and those dimensions can be used to predict the magnitude of the impact that a specific event type will have on volatility.

In the graphic below, I have distilled the above into five dimensions and have provided a framework for thinking about how they impact volatility. A high volatility event would therefore generally have little advance notice (note the “Low” designation at the top of the arrow, meaning that a low level of the element translates into high volatility), have a long duration, involve a high degree of (or potential for) contagion, not be recurring, and not be reversible. Also, the contagion element normally has a greater impact on volatility than advance notice, which tends to be a more important volatility factor than reversibility, etc.
[source: VIX and More]

As always, feedback is encouraged.
Tuesday, October 7, 2008

Another VIX Record Close: 53.68

The VIX handily surpassed yesterday's record close of 52.05 by establishing a new mark of 53.68 today.

For most of today's session, yesterday's VIX record looked safe, until a flurry of selling in the last half hour lifted the VIX to a new end of day high. Today is the third record close for the VIX in the last seven sessions. Also of interest, today's intra-day high of 54.19 was the second highest on record, behind yesterday's 58.24 mark.

One bit of obscure VIX trivia: today the VIX closed 116% above the 100 day moving average of 24.87, yet another VIX record.

As a reminder, VIX calculations continue until 4:15 p.m. ET, which is when trading ends for the underlying SPX options.

XLF Equals Mid-July Low

The all-time low for XLF was 16.61 back in July. XLF, the closely-watched financial ETF, just touced this low as I type this, following the report of a pending U.K. bank bailout/rescue plan.

VXO Chart from 1987-1988 and Explanation of VIX vs. VXO

In the past, I have gone to some length to differentiate between the VIX and the VXO, but given all the confusion I have seen in the media over new VIX records, I think it is time to offer up some history that may help clarify the situation.

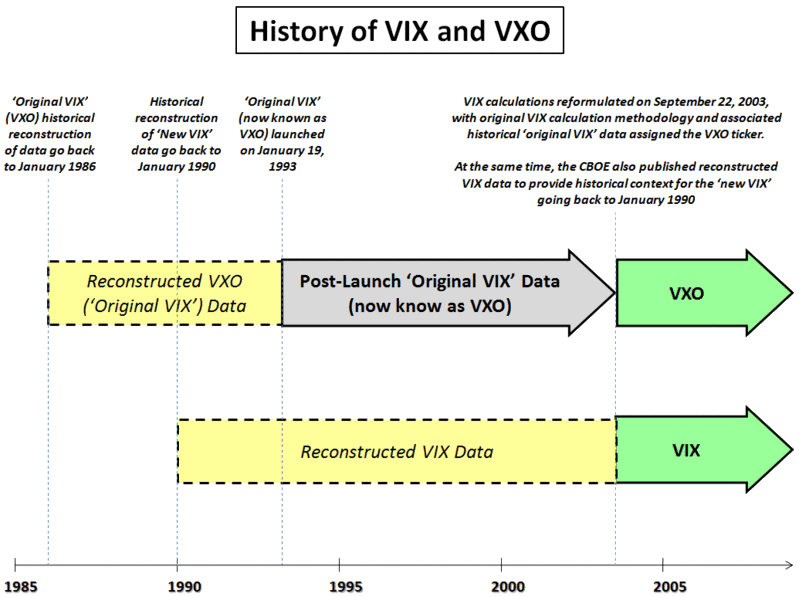
A good place to start, frankly, is with a prior post that I titled Ten Things Everyone Should Know About the VIX. For the visual learners out there, I have reduced the history of the VIX and the VXO to a graphical timeline below. Here are some of the important facts in a nutshell:

  • The VIX was launched in 1993
  • In September 2003 the formula used to calculate the VIX was modified substantially
  • Data from the new 2003 VIX formula has been assigned the VIX ticker, but the CBOE published a reconstruction of historical data for the new VIX formulation going back to 1990
  • At the same time, the data (both historical and subsequent) associated with the ‘original VIX’ formula was assigned a new VXO ticker

The result is that for all practical purposes when you or your data provider refer to the VIX, this means the new 2003 VIX calculation and the historical reconstruction of the data for the new VIX formula. Similarly, the VXO ticker refers to VXO data from 2003 to the present, ‘original VIX’ data from 1993 to 2003, and a historical reconstruction of ‘original VIX’ data that goes back to 1986.

[source: VIX and More]

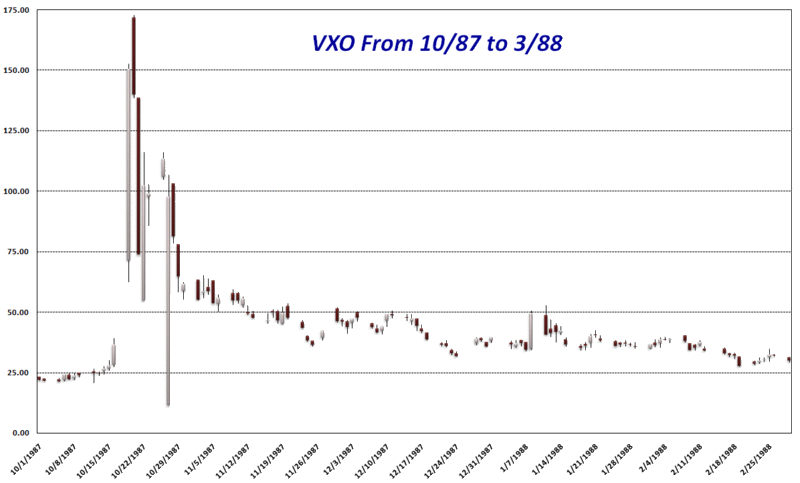
So, in terms of record-keeping, there was no VIX or VXO in 1987, but a historical reconstruction of the VXO arrives at an intra-day high of 152.48 and closing value of 150.19 for Black Monday, October 19, 1987 as well as an all-time high intra-day VXO of 172.79 for October 20, 1987. The chart below details the action in the historical reconstruction of the VXO for the period from October 1987 to March 1988, when the VXO finally slid back below 30.

[source: Yahoo, VIX and More]

Monday, October 6, 2008

Two Bond Blogs to Read

I joke about being "Your one stop VIX-centric view of the universe," but since that's what draws most of my readership to this site, I am happy to oblige by focusing on volatility and the equities markets.

On the credit markets side of the fear and anxiety equation, I give that subject less treatment here than it probably deserves (though it gets more attention in my newsletter.) Part of the reason for this is the two bond blogs I read religiously that do an excellent job of covering the debt universe:


I highly recommend that you check these two blogs out and make them part of your daily reading.

VIX Over 56; Expect Snap Back Soon

I suspect the current level of panic is nearing a climax

VIX Sets New Record of 50.75

Given market conditions, the levels of the VIX continue to suggest an orderly selloff, with the VIX still being held back by a strong gravitational pull.

If the DJIA fails to hold the psychologically important 10,000 level, we might see more in the way of anxiety.

Genuine panic should put 55 and perhaps 60 in play very quickly.

VIX Expected to Open at 53-54

There are still 25 minutes before the markets open for today, but based on the futures, the day of the week and other factors, it looks like the VIX will break the 50 mark for the first time ever at the open. At this point, I am estimating a VIX in the 53-54 range at the open. This would break the previous VIX record of 49.53 set during the Long-Term Capital Management crisis.

Friday, October 3, 2008

Environmental Factors and Chart Reading

I happen to think that charts provide important clues to the behavior of participants in the various financial markets.

Of course there are many ways to read a stock chart and consequently it can be more of an art than a science, so when I see some related scientific studies, I tend to take note of their conclusions. One example is Do You Want to Believe? which appeared today in Science Friday.com and discusses an experiment in which subjects had varying degrees of control over their situation and were tested on how likely they were to see imaginary images embedded in snowy pictures

Jennifer Whitson, one of the authors of the report, describes the findings as follows:

“People see false patterns in all types of data, imagining trends in stock markets, seeing faces in static, and detecting conspiracies between acquaintances. This suggests that lacking control leads to a visceral need for order – even imaginary order.”

The bottom line: if your investments have been faring poorly lately and you have had trouble reading the trends, make an effort not to be overly reliant on charts – or at least make sure to use a consistent quantitatively-based approach to analyzing those charts.

Thursday, October 2, 2008

S&P 500 Index Sets New Volatility Record for Fourth Consecutive Day

When measuring volatility, there is a tendency to focus on historical volatility and implied volatility as the appropriate yardsticks. One looks backward and is a statistical calculation; the other looks forward and lets market participants estimate future volatility.

The VIX gets the bulk of the press, but as a measure of implied volatility, it tells you nothing about what has just happened.

Don Fishback and Adam Warner (Daily Options Report) have opined that historical volatility can be as useful in measuring volatility as implied volatility.

Depending on one’s purpose, I am inclined to agree. In fact, in addition to implied volatility and historical volatility (which is simply the standard deviation of the log of returns of a period of X days), I am a big fan of Average True Range, which is also known simply as ATR.

Developed by J. Welles Wilder and first made public in the classic New Concepts in Technical Trading Systems, ATR first calculates true range as the maximum of:

  1. the difference between today’s high and low;
  2. the difference between today’s high and the previous close;
  3. the difference between today’s low and the previous close.

Average true range is simply the true range averaged over a standard lookback period (most often 14 days), traditionally using an exponential moving average, but sometimes using a simple moving average.

Now for the punch line, which is probably a couple of paragraphs too late: in each of the past four days, the S&P 500 index (SPX) has set new all-time highs in its 30 day historical volatility reading, as well as the simple moving average version of ATR. Further, if you normalize ATR by dividing it by the daily close of the SPX, the past four days have also seen new all-time highs in the normalized ATR.

So…the VIX may be pulling back a little, but backward looking measures of volatility such as historical volatility and ATR are continuing to establish new all-time highs.

Further reading:

Wednesday, October 1, 2008

A Week in the Life of VIX Calls

Last week I talked a little bit about VIX Options as Catastrophe Insurance and talked about how VIX options are priced off of VIX futures, not the cash/spot VIX index that is quoted in the press. A lot can happen in a week.

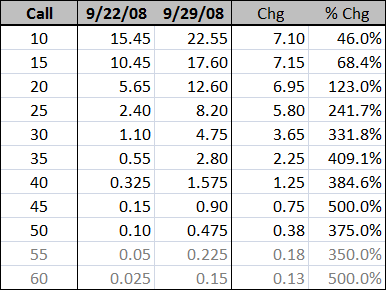
In the graphic below, I compare VIX October calls for selected strikes from 10 to 60 as they were quoted (using the midpoint of the bid and ask) at about 2:30 p.m. EDT on September 22nd and again after the market closed on September 29th.

During the course of the week, the VIX jumped from 31.74 to 46.72, a 14.98 point gain or 47% increase. As you can see, even the deep in the money VIX calls (i.e., the 10 and 15 strikes) failed to move even half as much in absolute terms as the cash VIX. The 30 strike, which was below the cash VIX prior to the spike, only moved about ¼ as much as the cash VIX. Looking out to the 45 strike, those VIX options gained all of 0.75, or about 5% as much as the cash VIX moved during the week.

For the record, from September 22 to September 29, the VIX October futures advanced approximately 21%, from a little over 25 to a little over 31.

I will have much more to say about the behavior of VIX options and futures, particularly in and around the September 29 VIX spike, going forward.

[NOTE: The grayed out numbers means there was no bid, so the calculation above is half of the ask]

DISCLAIMER: "VIX®" is a trademark of Chicago Board Options Exchange, Incorporated. Chicago Board Options Exchange, Incorporated is not affiliated with this website or this website's owner's or operators. CBOE assumes no responsibility for the accuracy or completeness or any other aspect of any content posted on this website by its operator or any third party. All content on this site is provided for informational and entertainment purposes only and is not intended as advice to buy or sell any securities. Stocks are difficult to trade; options are even harder. When it comes to VIX derivatives, don't fall into the trap of thinking that just because you can ride a horse, you can ride an alligator. Please do your own homework and accept full responsibility for any investment decisions you make. No content on this site can be used for commercial purposes without the prior written permission of the author. Copyright © 2007-2023 Bill Luby. All rights reserved.
 
Web Analytics