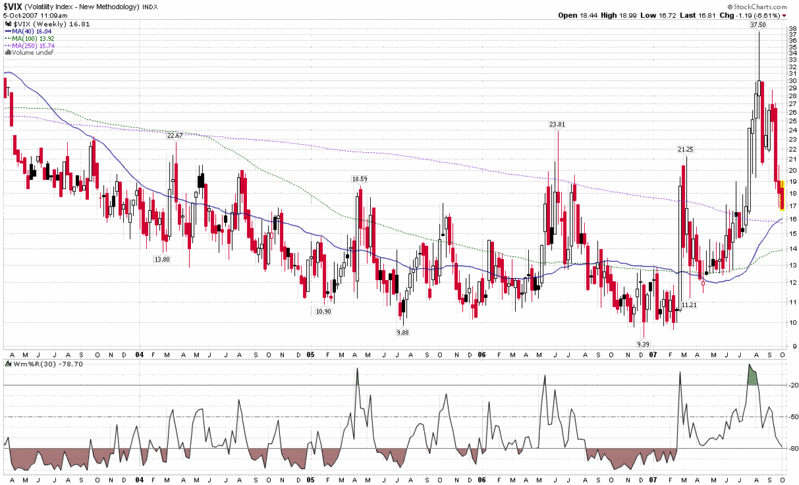
Where Will the VIX Find a Bottom?
 Let me start out by stating for the record that I have no idea whether it is appropriate to use traditional charting and other technical analysis techniques to attempt to determine support and resistance levels for the VIX. After all, the VIX is a multi-generational derivative that is a good distance removed from reality. For purposes of simplification, think of the VIX as a shadow puppet (more accurately, the composite shadow puppet from 500 simultaneous light sources); if we want to learn more about it, should we study the shadows or consider the hands from which the shadows are cast? I have a tendency to talk about the shadows, but for charting purposes I am inclined to believe that they are still just shadows.
So…with that backhanded disclaimer out of the way, let me turn my attention to a VIX that just made an intra-day low of 16.63. Whether that number sounds high or low depends upon where you have been anchoring a ‘normal’ price in your mind. At 16.63, the VIX is 68% above the year’s low (9.87), 56% below the year’s high (37.50), and about 7% above the VIX’s lifetime mean, which stands at 18.93.
I recently made a guesstimate that the VIX would bottom in the 16-17 range in October and I have no reason to depart from that thinking. I will, however, offer the weekly chart of the VIX below as one way to think about that 16-17 support range. Instead of the long-term moving averages (which may look interesting, but are of dubious value), focus instead on the Williams %R number. When the %R crosses below -80, it has a tendency to signal a bottoming out in the VIX – to the extent that you can tell when a shadow puppet is bottoming out…


5 comments:
Bill i am watching VIX:SDX lately to gauge level of fear. Thanks for that tip, great work u doing here
I am a great fan of the VIX, and I'm glad i found your blog a few weeks ago.
I figured out when to buy the VIX again.
If you will visit my blog ,
I posted a very compelling, RVX chart, that just about puts the nail in the coffin for the IWM.
It’s a HUGE BUY signal, that tells exactly when to Short sell IWM, and that in turn tells you when the market has topped, and that's when I'm buying VIX
zee.....
http://z-stock.blogspot.com/
Thanks, Igor. I almost posted about VIX:SDS today; I watch it closely every day and find myself thinking about it a fair amount.
Z-Stock,
Interesting stuff; thanks for the link. I'm not yet persuaded, but I will do some digging over the weekend and probably have a formal response up on the blog next week. FWIW, I do think that you thinking is at least directionally correct.
Cheers and good trading,
-Bill
Cot is bearish wouldn't that sugesst a vix with like a 13-14 handle at most ?
I thought I should elaborate on my cot post it was a little vague. Seems that commercials in vix futures are excpecting even lower volatility and thus probably higher stock prices. They have timed vix declines and rallies really well. This would also suggest to me that the october sell off which everyone is expecting maybe pretty mundane.
Post a Comment