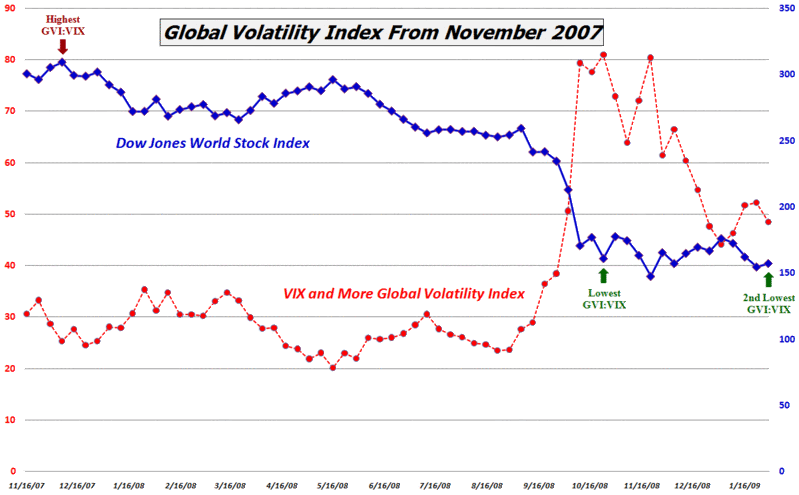
Bullish Signal from Global Volatility Index
VIX and More’s proprietary Global Volatility Index has been a big hit since I unveiled it in November, which means that I will periodically update it and flag interesting developments in this space going forward.
At the close of Friday’s session, the difference between the Global Volatility Index and the VIX had narrowed to its lowest level since October and the premium percentage (the GVI divided by the VIX) was at its second lowest level ever. I consider this to be a bullish signal.
In the chart below, I have marked the previous highs and lows in the premium percentage with red and green arrows. The red arrow marking the high comes from the first week in December 2007 and was an excellent opportunity to sell or get short. The green arrow from late October was an early bottom. In the months that have followed, the Dow Jones World Stock Index has largely marked time. While this indicator is still relatively young and untested, I consider Friday’s second lowest reading to reinforce or confirm the October buy signal.
As always, caveat emptor.
[source: VIX and More]


5 comments:
"I consider this to be a bullish signal."
Can you explain how you reached this conclusion a little more explicitly?
I understand the "it was high, then the market went down." N=1, but I can understand how that could reasonably be interpreted to conclude that extreme high values are a bearish signal.
Your other n=1 appears to me to go something like this. "It was low and the market went nowhere. As a result I conclude that since it is low again now the market will then go up." Am I missing something?
Bill, would you mind show me where I can find the global volatility index?
Thanks Bill.
mL
mL,
Click on the words "unveiled it" in the first sentence of the post to see it.
Bill
This sounds like a very interesting ratio, though i have not looked at it yet. My question is - how do you reconcile this with the VIX:VXV ratio?
Although the last couple of days may have been a bit different the VIX:VXV ratio has been bearish has it not? I mean, where in the past we have seen the VIX:VXV ratio similar to what it is now we have been at a point before longer term sell offs.
I'd be very interested to read what you have to say about this.
Best regards
Douglas
Thanks for the comments.
Regarding my conclusions about the viability of the GVI, these are based on the full data set (not shown), not just the highs and lows that I chose to pinpoint.
To find more information about any topic on the blog, you can:
1) follow the hyperlink in the text
2) go to the bottom of the post and click on any of the "labels" to pull up all posts with that same label
3) use the Google "Search the VIX and More blog" function, which is located in the right hand column, just to the right of the top of the second post
Regarding the VIX:VXV ratio vs. the GVI:VIX ratio, I have a preference for the VIX:VXV ratio, because it has a slightly better track record. One compares the VIX to time and the other compares it to geographies. Right now both are slightly bullish, so they are in agreement.
When the two agree, it increases my confidence level in the signals. When they diverge, I tend to favor the VIX:VXV (but I look at other signals as well.)
Cheers,
-Bill
Post a Comment