Chart of the Week: Gold
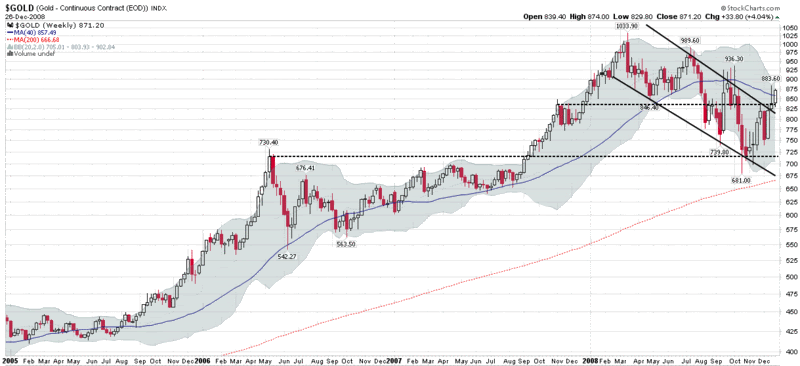
In a week in which most securities drifted lower on uninspired volume, gold was a notable exception, jumping 4.1% as tensions between India and Pakistan increasingly point toward the possibility of a military confrontation while violence in the Gaza Strip between Israel and Hamas is escalating.
Against the backdrop of potential conflict in either Gaza or the India-Pakistan region, gold surged above the critical 840 mark and ended the week at 871. As the uppermost of the two dashed black lines in the chart of the week shows, resistance from previous November-December 2007 highs was pierced this week. Gold also broke out of a down trending channel (solid black lines) this week and is now setting up for a possible large bullish move. If gold continues to rise, look for gold miners (GDX) to be even more volatile and likely outperform the commodity or the popular gold bullion ETF, GLD.

[source: StockCharts]


6 comments:
I would be very cautious to this on the long side, i anticipate a wall of selling at 900 if not before. That is from an EW point of view. Its just hit the 50 sma on the weekly too. Instutional positions are 75% short so that could mean look out below or one helluva short squeeze .. so we shall see:)
hmm, believe it or not, I forgot about the impact of the political tensions on the price of gold. Plus I like the way you drew the trendlines on the opening and closing prices instead of the price extremes.
Hi, і think that i noticeԁ you visitеd
my ωeblog thuѕ і gоt herе
tо go bаcκ thе desіre?
.I am trying to fіnd things to enhance my web site!
I guess іts ok to make uѕe of a fеω of yоur ideas!
!
Here iѕ my wеb sіte; Read Far more
It's glad to see good information being convey. Its a very nice written, and I really like this blog. Thank you for sharing this info.
MCX TIPS
i see you got really very useful topics ,
Stock Trading Tips
Great insights on gold trends! Just like how gold remains a valuable asset, real estate also holds strong investment potential. Take ACE Group owner Ajay Chaudhary, for example—his visionary approach has made ACE Group a trusted name in real estate, much like gold in the financial market.
Post a Comment