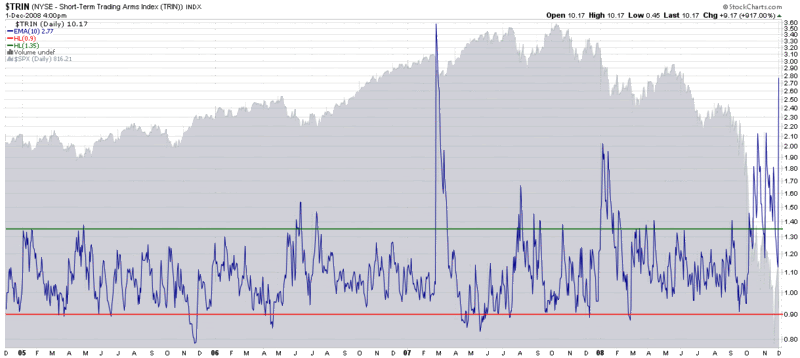
Arms Index Extremely Extended
The Arms Index or TRIN is an indicator that I watch closely for short to intermediate-term setups. The indicator which combines ratios of advancing issues to declining issues and advancing volume to declining volume is a reasonably reliable contrary signal.
Since mid-October the Arms Index has been generating a number of historically high signals. In the chart below, I used a 10 day exponential moving average as a smoothing factor. Note that the TRIN’s 10 day EMA appears to have climaxed yesterday in the manner that has historically provided excellent buying opportunities. To my ears, yesterday’s climax in the TRIN is suggesting that the November 21st bottom is likely to hold. Shorts beware…

[source: StockCharts]


10 comments:
The major difference between now & those prior levels is leadership.The prior times the ARMS hit excessive levels as charts reflects we had it. Where is it? What is it?
Sorry Bill , but i have not found your indicators (such as the VIX/VXV, for example) giving reliable signals in this current unprecedented market environment.
Come to my world : stay short and win.
I'm trying to plot the same graph in stockcharts.com but I'm not able to see only EMA(10) alone like the chart you posted. I always end up with $trin + EMA(10)which cause huge spike on $trin and gives me a big scale on Y axis. Could you please post the link for your chart so I can see your parameters? Thanks!
Michael
DF,
I agree the lack of leadership is an issue. I am not sure where it is going to come from, but I am not ruling out some of the beaten down sectors like financials and homebuilders.
Anon,
Clearly many things that worked very well until September have not been effective in a post-Lehman world. As for long vs. short, I like to think of myself as directionally agnostic, though I am developing a long bias at the moment.
Michael,
The trick in StockCharts is to go to the Attributes / Type section and change whatever kind of chart you have (candlestick, area, line, etc.) to invisible. That will give you the scaling you want and ensure that the EMA is the focus instead of the daily bars.
Cheers,
-Bill
Bill,
I remember before September, when VIX is over 30s, it is a good indicator to buy. Does VIX/VXV ratio do any better? And how much better?
mL
not sure if you have seen this, bill
http://bigpicture.typepad.com/comments/2004/03/chart_of_the_we_4.html
mL
I agreed with the shorts. This is an event in 100 years, we only have 1929 to compare. I think the indicator won't work in this environment. I tried buy dip so many times last two months and got burned again and again.
Short the rally, buy extreme low is the way to go. Some traders calling for dow 6000 to be the bottom.
Longs be careful as well.
I have a sense that the TRIN has been contaminated somewhat by ultrashort ETFs, so that going long those assets (SH, DXD, DOG, SDS, for example) represents a form of hedging to the downside, thus distorting the TRIN's true representation of the market. Your thoughts?
Good comments all around.
mL,
Regarding the VIX:VXV ratio, it has not been providing profitable signals since the Lehman brothers bankruptcy. I hope to have an update on this ratio soon.
Also, thanks for the Big Picture link, I had not seen Barry's historical perspective on the TRIN until you brought my attention to it.
Anon and BillTxn,
Clearly a lot of the indicators that had been working well for the past few years have been turned upside down in the past three months.
I wish it were not the case, but I find it fairly easy to come up with a scenario that gets us to Dow 5000. FWIW, I don't think it's the most likely scenario, but I certainly don't want to ignore it. Also, while 1929 concerns me, Japan in 1990 concerns me at least as much.
Regarding leveraged inverse ETFs, this is one of my favorite research areas of late. Clearly they have had an impact on a number of indicators, but trying to quantify that impact in highly unusual market conditions has not been easy.
Cheers and good trading to all.
-Bill
I am like more VIX index and her emulated with vix 1986-1987 from 2007.I am believe that vix to go 160 in few weeks.Trin not relevance .
Post a Comment