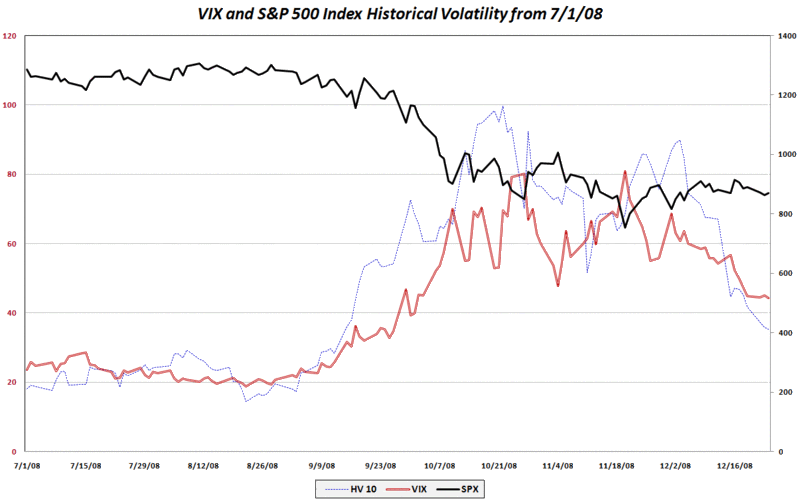
SPX Ten Day Historical Volatility at Lowest Level Since September 12
There are quite a few ways in which to measure historical volatility. Probably the most responsive of the time periods commonly measured is the 10 day historical volatility (HV) period, which covers the last 10 trading days. Variously referred to as statistical volatility, realized volatility, actual volatility, etc., the 10 day historical volatility measure for the SPX (dotted blue line in chart below) peaked on October 22nd at just a fraction under the 100 level. On December 3rd the 10 day HV was still holding strong at 89, but it has fallen precipitously over the course of the last three weeks and is down to just 35 as of Wednesday’s close and on target to dip as low as 33 or so today.
For comparison purposes, the 10 day HV in the SPX has not been below 35 since September 12th, just prior to the Lehman bankruptcy.
The bottom line: while a VIX in the low 40s may look cheap at the moment, consider that the recent historical volatility in the SPX has been slightly more than three quarters of that represented by the VIX. Of course, the December holiday effect has artificially depressed volatility to some extent, but certainly cannot claim full responsibility for the drop in 10 day HV from 89 to 35.

[source: VIX and More]


3 comments:
Bill
I started to look myself at some form of historical volatility - well, just standard deviation. I didn't get as far as running any test to see what it's relationship or otherwise with VIX or the VXO might mean.
I wondered whether the ratio between implied and historic volatility would say anything more than the raw numbers. Do you think that this line of enquiry is worth looking at? If so - what number of days going back do you think is most appropriate to look at?
Douglas,
I absolutely think that this research is worth pursuing. I would start with 10, 20 and 30 day lookback periods.
Happy holidays and best of luck in '09,
-Bill
buy propecia propecia reviews by women - propecia time for results
Post a Comment