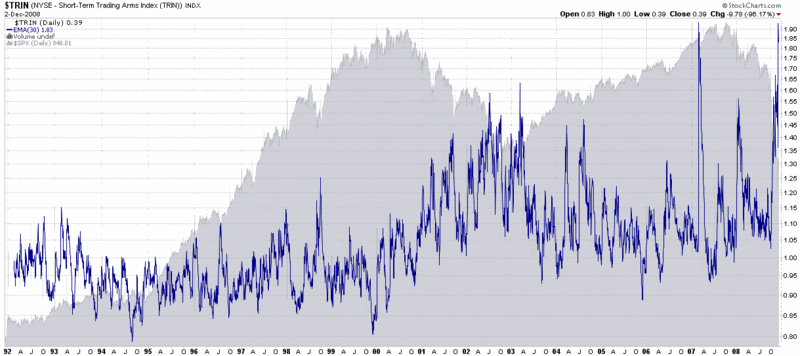
Arms Index Going Back to 1992
I’m glad to see that yesterday’s Arms Index Extremely Extended post received so much attention.
One of the concerns raised by a reader was that my chart of the Arms Index (TRIN) only looked back to four years of history, so that the historical context prior to the current bear market consists entirely of bull market readings. For this reason, today’s chart goes all the way back to the beginning of TRIN data available at StockCharts.com.
In the chart below, the 17 years of TRIN data results in such compressed and difficult to read 10 day EMA cycles that I have lengthened the exponential moving average period from yesterday’s 10 days to a 30 day EMA. Fortunately, because it is an EMA instead of an SMA, the peaks in the TRIN cycles are almost identical whether the EMA period is 10, 30 or 50 days.
I have also removed the red and green horizontal lines from this long-term chart to reflect the fact that the TRIN had a lower mean prior to 2000, trended higher during the bear market from 2000-2003, and seems to have found a new mean value from 2004 through 2008. For this reason, considered over the course of multi-year time frames, the TRIN is best thought of in relative terms rather than absolute terms.
As I noted with yesterday’s chart, spikes in the TRIN have “historically provided excellent buying opportunities.” Low TRIN readings may also have some value from a market timing perspective, but these signals are generally not as robust as high TRIN readings. Finally, the TRIN is far from perfect in predicting market inflection points, but it does have a track record that is accurate enough to bear watching. As I noted yesterday, the TRIN is best suited for short to intermediate-term setups.


2 comments:
Nice plot.
I'd sure like to have daily access to the $TRIN data. (BTW, StockCharts only sells data back 2 years. How did you get them to give you that data?)
Regards,
Tom
Hi tomhoo,
StockCharts may only have the last two years of historical data available in table for for downloading, but with certain subscription levels you can create charts with whatever periods are covered by their full database of historical values for that symbol.
I'm sure other fee-based data services have a longer historical record, but I have not purchased the a full data set, so I do not know how far it goes back.
Cheers,
-Bill
Post a Comment