Showing posts with label defaultism. Show all posts

Thursday, July 3, 2008

On Measuring Volatility

Mike at HEDGEfolios.com has a good post up today with the title of Measuring Volatility. He touches a lot of bases, but it all starts with the following statement:

“When it comes to measuring or sensing stock market volatility, I do not follow the VIX.”

Now I may have invented that silly tagline, “Your one stop VIX-centric view of the universe,” but I am the first to argue that a defaultist mind set is the wrong way to approach the investment landscape. If you follow the same indicators with the same default settings as everyone else, you are setting yourself up not just to follow the crowd, but to be a half step behind it. In order beat the crowd, what is needed is a variant perception.

Back to HEDGEfolios for a moment:

“The key element of volatility using traditional methods like the VIX rests on the reversal at extremes in a contrarian indication such as buying when the VIX exceeds 30. This is a very dangerous concept and I do not advocate for its use… I never liked that approach so I do my own thing and look at each stock, the turnover in each and how the composite of all signal changes indicates the market volatility.”

Volatility is a wide-ranging concept. It can be defined, measured and applied to over 10,000 stocks and ETFs in many different ways. To think that best way to harness information about volatility is to buy when the VIX hits X is ludicrous.

Consider that the concept of volatility can be applied not just to price, but to volume, options prices, market breadth data, etc. Volatility is a characteristic of every slice of the almost infinite flow of data that is associated with the markets.


It’s not just what you measure, it’s how you measure it. Volatility can look forward when it is in the form of a forecast or a derivation, such as implied volatility. When volatility looks backward, the opportunities to get creative are even richer. There is historical volatility, average true range, Bollinger bands, Chaikin volatility, relative volatility, and a variety of ways in which to index volatility.

Go ahead and watch the VIX, but don’t think for a moment that you are going to have an advantage over the thousands of other people who are watching the same indicator. Sure, you might come up with the next great VIX permutation, but you are far more likely to get a leg up on the competition by revisiting some basic questions:
  • Is volatility worth following?
  • How can more knowledge about volatility make me a better investor?
  • Which aspects of volatility should I pay attention to?
  • How should I measure that type of volatility?
  • How do I interpret those measurements for maximum ROI?
One of my favorite measures of volatility is the number of buy and sell signals my various systems generate each evening. It’s simple, but effective. And I can be sure that nobody is not going to show up on CNBC tomorrow touting the same approach.

Monday, June 16, 2008

Bollinger Bands and the Standard Deviation Setting

On Friday, I used Bollinger Bands: Why 20 Days? as an excuse to begin my “evangelical crusade against rampant defaultism.” I did this mostly so I could make up a word (or so I thought, apparently others beat me to it), but also to warn against the tendency to favor the default settings in charting software in lieu of rigorously exploring the alternatives.

Using Bollinger Bands as my guinea pig indicator, on Friday I explored what happens when you tweak the default setting of 20 days. The other important setting in Bollinger Bands, of course, is the standard deviation setting. In Bollinger on Bollinger Bands, John Bollinger cites tests he conducted on various stocks, indices, currency pairs, and commodities, the results of which led him to conclude that a 2.0 standard deviation setting was quite robust across a variety of asset classes and time frames. Bollinger went on to recommend that the standard deviation setting should be decreased to 1.9 for a time window of 10 days and increased to 2.1 standard deviations when the time frame is extended to 50 days. In other words, modifying the number of days is more likely to provide additional insight than adjusting the standard deviation setting.

Undeterred, I have had a lot of fun experimenting with the standard deviation setting for VIX charts and a number of other charts. My takeaway: even if you do not discover any particularly revealing new information, it is important to experiment with the default settings to get a better understanding of how the indicator works in default mode and why the bands act the way they do.

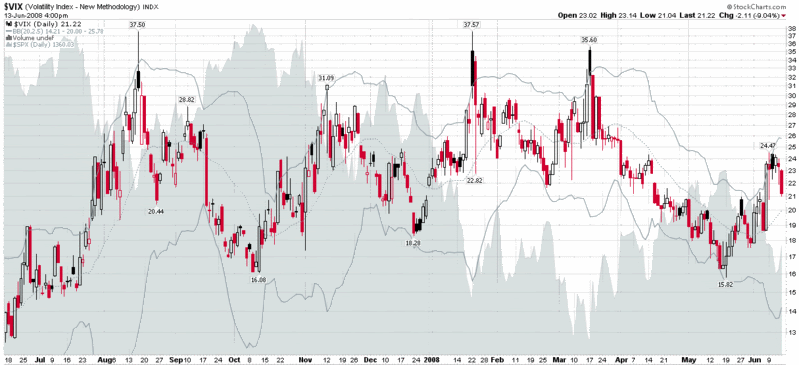
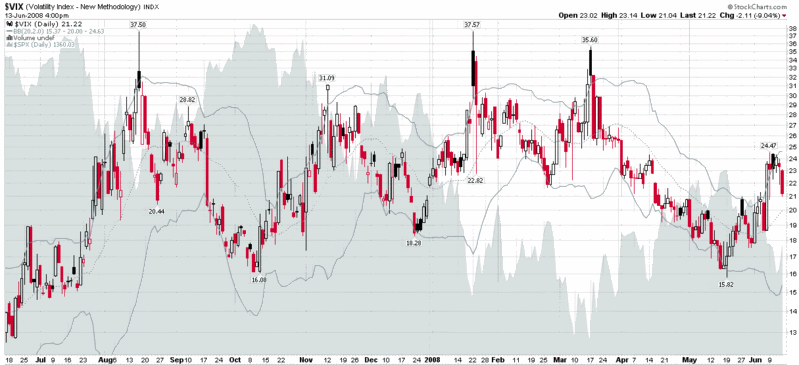
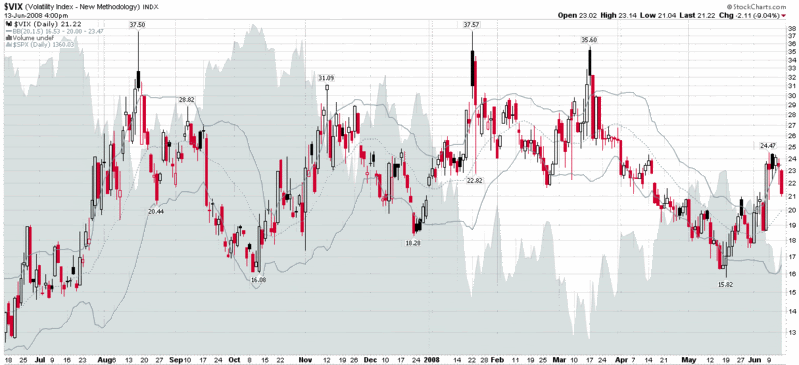
In the VIX charts below, I have included the 2.5 standard deviation setting on the top, with the default 2.0 standard deviation setting in the middle, and the 1.5 standard deviation setting on the bottom. As the graphics show, the standard deviation settings can be fine tuned to adjust the frequency of signals generated by the indicator in a given time period. The exact settings should be largely a function of one’s preferred trading time horizon.

Friday, June 13, 2008

Bollinger Bands: Why 20 Days?

I am surprised by how many traders, bloggers, and hybrids (a category I seem to have morphed into) are content to stick with the default settings offered by their favorite charting package. On a related note, one reader had asked me why I stick to the 10/50/200 simple moving averages on most of my charts; another reader regularly decries the laziness of the default charting crowd, adding that they deserve the mediocre performance that their lack of curiosity and imagination undoubtedly lead to.

So consider this the first post in my evangelical crusade against rampant defaultism.

Let’s start with simple moving averages. Personally, I prefer my standard chart of daily bars to have SMA settings of 16, 38 and 155 days. That is not much different from the 20/50/200 setting that is favored by many charting packages, but it works for me and it gives me a slightly different perspective on the world, which often makes it easier to take a position against the crowd. Of course, I have different settings for looking at narrower or broader time frames.

Moving on to an example, Bollinger Bands is one of the indicators for which I rarely see anything other than the default settings of 20 days and 2 standard deviations. Why is this? Is it laziness? Is the indicator so perfectly constructed as to defy tweaking? Is it possible that 20 days and 2 standard deviations work that well over all time horizons? Hardly. Read Bollinger on Bollinger Bands to see what John Bollinger has to say on the subject or do some experimenting on your own without the safety net of Bollinger’s commentary (for more information on Bollinger Bands, check out John Bollinger’s Bollinger Bands web site.)

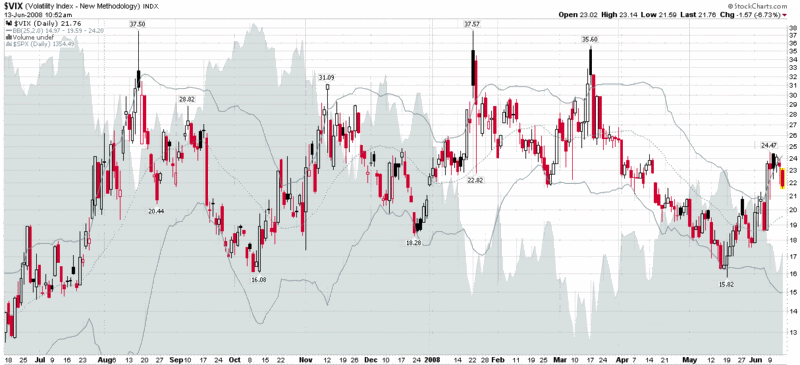
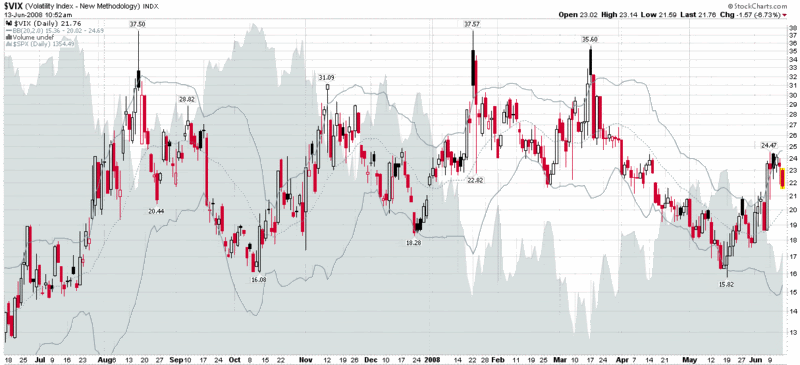
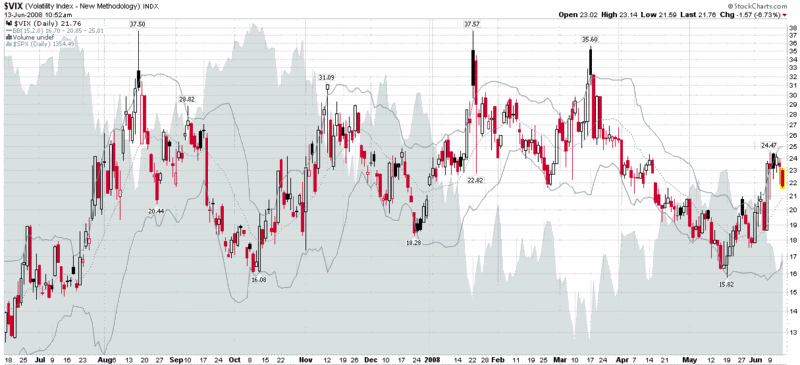
In the three charts below, I have modified the Bollinger Bands setting to reflect a 25, 20, and 15 day setting – while keeping (at least for today) the 2 standard deviation parameter intact. Without providing too much commentary, note that in the top chart, the 25 day setting casts what I call a longer ‘time shadow’ to the right of any major moves. This time shadow is muted somewhat in the second chart (20 days) and is even less noticeable in the bottom chart (15 days). Note also how the 25 day setting almost resembles Donchian Channels (aka price channels), while the 15 day setting hugs the price action closely enough so that even a gentle trend can exceed the standard deviation bands. Consider, for a minute, the possible implications of customizing Bollinger Bands for securities that have a greater tendency to trend (i.e. commodities) vs. those that have more pronounced mean-reverting characteristics, like the VIX.

DISCLAIMER: "VIX®" is a trademark of Chicago Board Options Exchange, Incorporated. Chicago Board Options Exchange, Incorporated is not affiliated with this website or this website's owner's or operators. CBOE assumes no responsibility for the accuracy or completeness or any other aspect of any content posted on this website by its operator or any third party. All content on this site is provided for informational and entertainment purposes only and is not intended as advice to buy or sell any securities. Stocks are difficult to trade; options are even harder. When it comes to VIX derivatives, don't fall into the trap of thinking that just because you can ride a horse, you can ride an alligator. Please do your own homework and accept full responsibility for any investment decisions you make. No content on this site can be used for commercial purposes without the prior written permission of the author. Copyright © 2007-2023 Bill Luby. All rights reserved.
 
Web Analytics