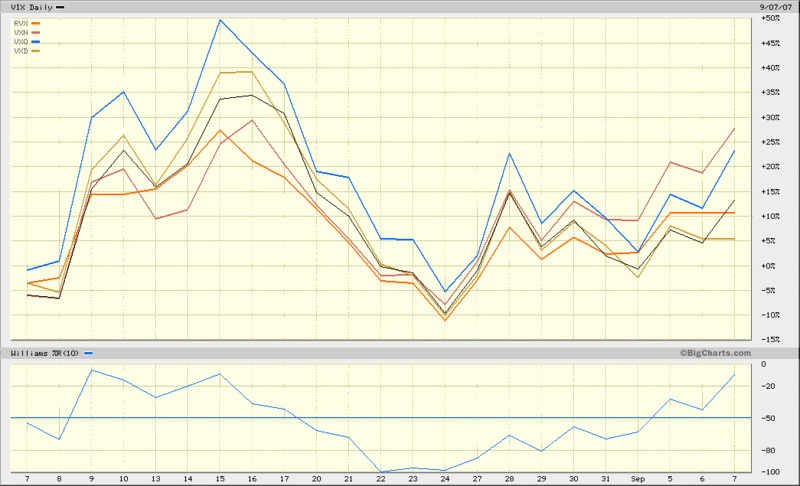
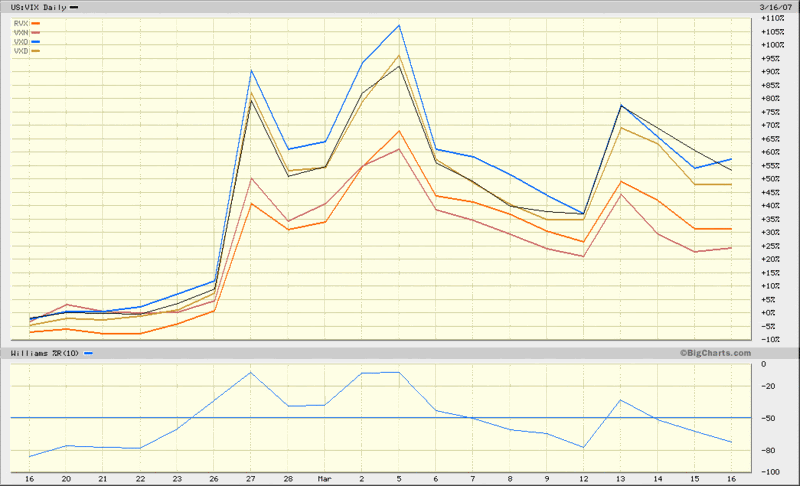
Volatility Index Comparison
I last put up a chart of the five US equity volatility indices in mid-March, following the February 27th VIX spike. Now that we also have about three weeks following the VIX spike, I thought I might put up a similar chart of the volatility indices for the recent market action.
The recent volatility spike (top chart) shows VXO once again leading the charge upward, with VXN the laggard -- just as was the case in March. Interestingly, during the secondary surge in volatility over the past two weeks or so, the VXN has been the most sensitive.
With VXN and RVX options just around the corner, the relative movements of these volatility indices are becoming increasingly more interesting (and important) to watch.


6 comments:
Enjoy your work very much. One slight suggestion, though. Can you make your charts linkable so i can see the whole chart? Embedding them like you do always seems to cut off the most recent week of data.
Keep up the interesting work!
Hi anon,
I've gone back and forth on linking vs. embedding and for now I think I'm going to go with embedding, unless there is a groundswell of opinion against it.
There are a couple of workarounds I can offer you, though. If you use Firefox or Flock, just right click on the image and try "View Image." Also, "Copy Image Location" or "Properties / Location" will allow you to paste the original image into a new window. In IE it is a little more unwieldy, as I believe you have to use the "Properties" command to copy and paste the address into a new window.
Thanks for the suggestion; I hope this helps.
Cheers,
-Bill
Recently discovered your site, have added it to my regular readling list - would like to hear any speculation you have on the RVX swapping it's position relative to the other volatility indices from the March event to the current fun.
TIA
Thanks for the kudos, anon.
Regarding the RVX action, the RVX had a fairly similar relative performance in Feb/March and August. I am assuming you mean the VXN, which lagged in Feb/March and again in August, but has become the most volatile in September.
I'm not sure I have a good answer to the question about resurgent relative VXN volatility, but some if it is probably the NDX returning to its 'normal' place as more volatile than the SPX. I'm sure another factor is the lessening concern about financials (or at least some desensitization), which disproportionately impact the SPX vs. the NDX.
Cheers and good trading,
-Bill
have a peek at this web-siteMore Help great post to readhis explanation check over herebest site
click over here Dolabuy Loewe hop over to here Source additional resources replica ysl bags
Post a Comment