Showing posts with label cash on the sidelines. Show all posts

Sunday, October 31, 2010

Chart of the Week: Money Market Mutual Funds

When the first version of this week’s chart of the week first appeared on the blog in Chart of the Week: Change of Trend in Cash Holdings? in January 2009, it generated a surprising amount of controversy. A follow-up post in March 2009, Cash on the Sidelines Headed Back to Stocks? also seemed to polarize some of the readership here.
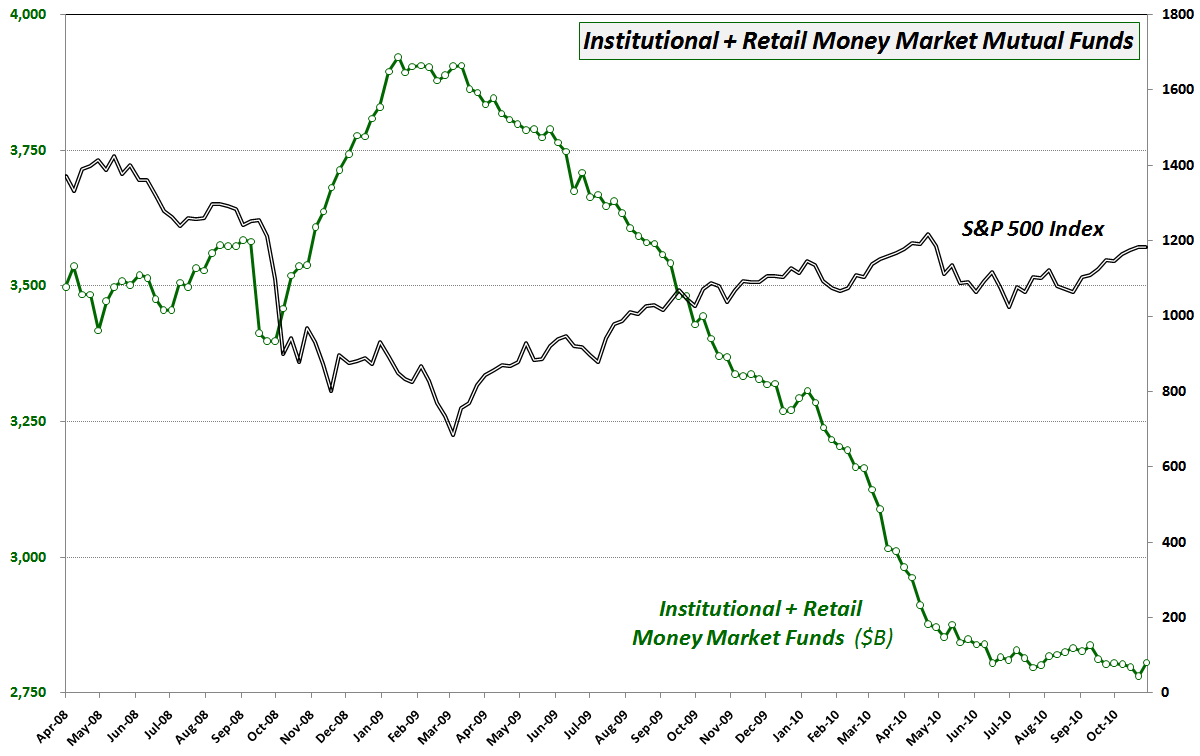
In retrospect, this data from the Investment Company Institute (ICI) as well as similar data from AMG Data Services did an excellent job of keeping track of the flow of funds in and out of cash and therefore have been excellent proxies for a large part of the net change in demand for equities.

In the chart below, note that money market mutual fund assets began declining sharply in the second week in March 2009 (after topping in January 2009,) just as stocks were bottoming and starting to catch a bid. In the twenty months since the bottom in stocks, net changes to money market mutual funds have been a solid coincident and sometimes leading indicator of demand for stocks.

I am resurrecting this chart again for several reasons, not the least of which is that the decline in money market mutual funds has lessened considerably since the end of April, when stocks hit their 2010 highs. Additionally, last week’s increase of $25 billion in money market mutual funds was the largest since July 2009 and the second largest since January 2009. While this may not mean anything, I like to be provocative with these kinds of charts. Readers should at least be open to the possibility that most of the cash on the sidelines that will ultimately be committed to stocks in a bull market has already been committed. Perhaps it will take a significant downturn in bond prices for the next large pool of money to be moved into equities.

Either way, I still think this chart of money market mutual funds bears further watching.

Related posts:


[source: Investment Company Institute]

Disclosure(s): none

Monday, March 23, 2009

Cash on the Sidelines Headed Back to Stocks?

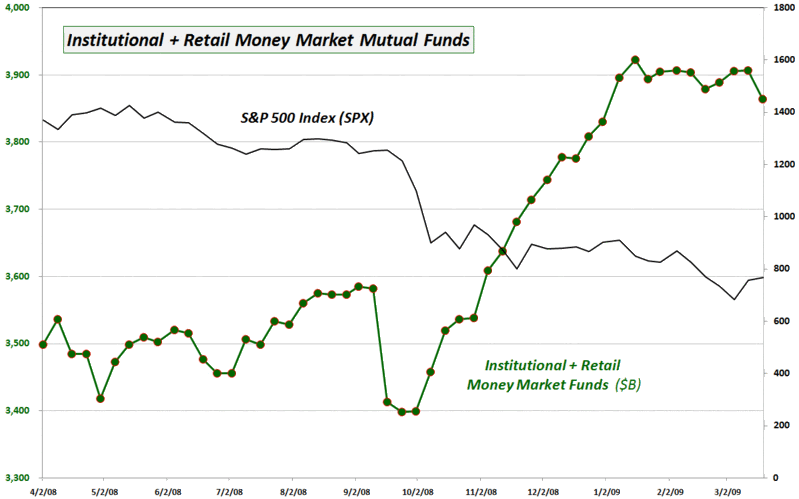
Two months ago, in Chart of the Week: Change of Trends in Cash Holdings? I posted a chart based on money market mutual fund cash levels as calculated by the Investment Company Institute’s (ICI) that generated a considerable amount of discussion when I concluded that the chart may be pointing to a topping trend for cash on the sidelines.

Fast forward to the present and as the updated version of the same chart shows, the mid-January drop in money market mutual fund cash levels turns out to indeed have been the beginning of a change in trend, at least according to the ICI data.

In fact, last week’s data, which cuts off on Wednesday, shows the largest drop in money market mutual fund cash levels in over six months.

With rates on money markets and bonds both headed lower, I would not be surprised to see more money flowing back into stocks for the simple reason that alternative investments have become less attractive.

[source: Investment Company Institute, VIX and More]

Saturday, January 24, 2009

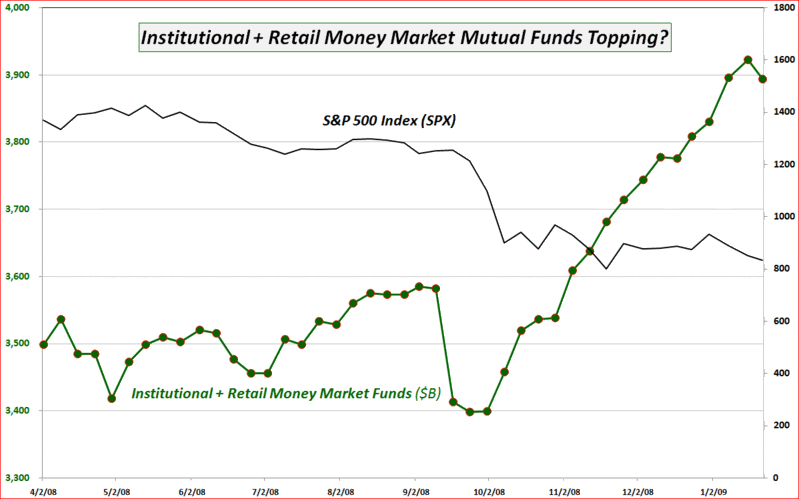
Chart of the Week: Change of Trend in Cash Holdings?
Tempting though it may be to slap up yet another chart of the financials (XLF), bank index (BKX) or one of the individual bank that seems to be floundering even more than its peers, this is what I did with Bank of America (BAC) in last week’s chart of the week. The story has not changed much this week, except that the picture has become even uglier.

There may be a story developing, however, in terms of cash on the sidelines. According to data from the Investment Company Institute, cash in money market mutual funds jumped over 45% from August 2007 through last week, when it reached an all-time high. The chart below shows how cash on the sidelines has increased dramatically since last October, leaving less fuel to keep the S&P 500 index aloft. During the past week the ICI reported the first meaningful drop in money market mutual fund cash levels since September and also only the second time in 16 weeks that cash levels have dropped for institutional investors.

If the change in money market mutual fund levels from the past week is the first signs of a change in trend, then this will almost certainly have significant bullish implications for equities.

[source: Investment Company Institute, VIX and More]

DISCLAIMER: "VIX®" is a trademark of Chicago Board Options Exchange, Incorporated. Chicago Board Options Exchange, Incorporated is not affiliated with this website or this website's owner's or operators. CBOE assumes no responsibility for the accuracy or completeness or any other aspect of any content posted on this website by its operator or any third party. All content on this site is provided for informational and entertainment purposes only and is not intended as advice to buy or sell any securities. Stocks are difficult to trade; options are even harder. When it comes to VIX derivatives, don't fall into the trap of thinking that just because you can ride a horse, you can ride an alligator. Please do your own homework and accept full responsibility for any investment decisions you make. No content on this site can be used for commercial purposes without the prior written permission of the author. Copyright © 2007-2023 Bill Luby. All rights reserved.
 
Web Analytics