Showing posts with label VIX Futures Contango Index. Show all posts

Thursday, January 27, 2011

The Skinny on XVIX

Of all the second generation volatility-based exchange-traded products that have been launched in the past few months, the one I find most intriguing is the UBS E-TRACS Daily Long-Short VIX ETN, which I prefer to refer to by its ticker symbol XVIX.

XVIX combines a 100% long position in the S&P 500 VIX Mid-Term Futures Excess Return Index with a 50% short position in the S&P 500 VIX Short-Term Futures Excess Return Index. It is therefore the functional equivalent of a position consisting of two units long VXZ and one unit short VXX. This combined long-short position nets out with very little exposure to volatility in most market conditions. Instead, XVIX is almost entirely a VIX futures term structure/contango play that increases in value when the slope of the VIX futures term structure is upward and/or getting steeper. On the other hand, XVIX comes under the most pressure when the slope of the VIX futures term structure is flattening or becoming downward sloping (i.e., entering into backwardation.)

While I was on a hiatus, Volatility Futures & Options put XVIX under a microscope in De-constructing XVIX and explored the historical data and the appeal of the 2:1 long-short ratio vis-à-vis a number of alternative ratios.

As I see it, XVIX is almost a pure play on the VIX futures term structure. The historical data provided by UBS and analyzed in some detail by Volatility Futures & Options shows annual returns in the 10-25% range prior to 2010, with a maximum drawdown in the 10-15% range. Last year has to be considered an outlier, as the mean daily contango as calculated by my proprietary VIX Futures Contango Index was 79, a huge premium over the lifetime average reading of 50 for this index. Not only was contango extreme in 2010, but it was also increasing for the majority of the year.

The bottom line is that 2010’s performance (up 55%, with a 5% maximum drawdown) in XVIX is not likely to be repeated any time soon. Over the long term, I expect XVIX to revert to annual returns in the 10-25% range. In the short-term, however, there may be some more significant bumps in the road as the VIX futures term structure unwinds some of its extreme contango and returns to a more consistently flat term structure.

Related posts:


Disclosure(s): short VXX; long VXZ and XVIX at time of writing

Tuesday, October 12, 2010

VIX Sets Two New Records

It is not every day that the VIX establishes some sort of new all-time record and it is rarer still that the volatility index sets two different records on consecutive days, but such has been the case at the beginning of this week.

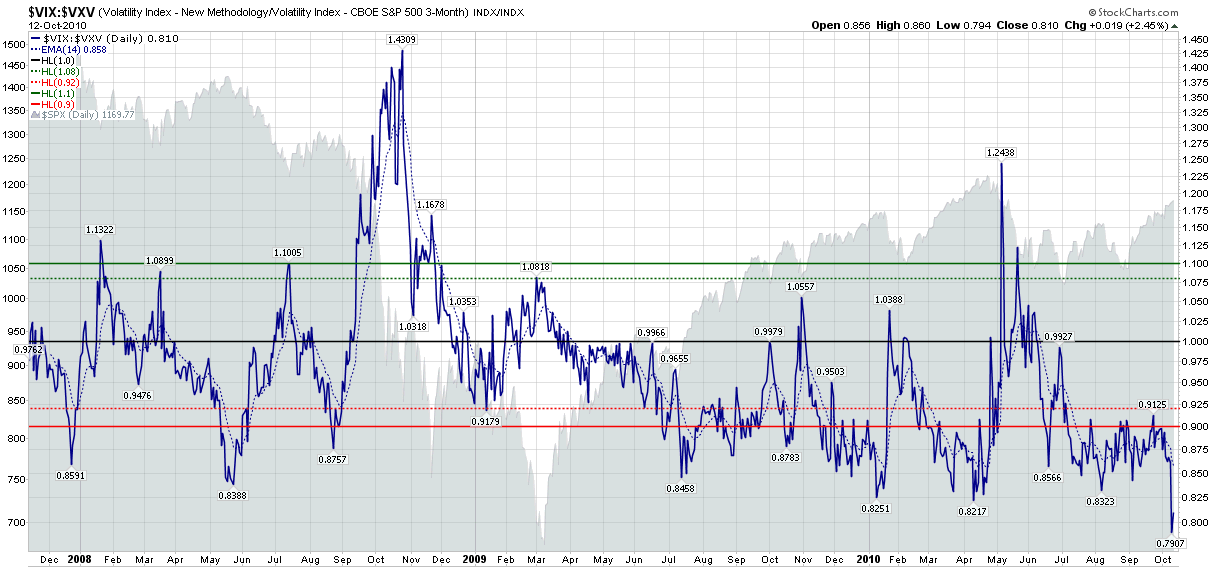
The first record, established on Monday, was in the VIX:VXV ratio – a subject that I covered on a regular basis in the first year or so following the launch of VXV, which is essentially a 93 day version of the VIX and whose formal name is the CBOE S&P 500 3-Month Volatility Index.

Long-time readers will recall that for the first year after VXV was launched, the VIX:VXV ratio performed flawlessly (see VXV Is One Year Old.) In a post-Lehman world, however, the VIX:VXV ratio has been inconsistent as the persistent extreme contango has made the ratio more difficult to calibrate. I have been doing some work on this, however, and will share some of my thinking about how to tweak this ratio going forward.

The latest record, established today, is in my proprietary VIX Futures Contango Index. I spelled out some of my thinking about the epic disconnect between the cash/spot VIX and the VIX futures in a post a month ago with the title of VIX Futures: What Are/Were They Thinking?

In the end, the VIX:VXV ratio and the VIX Futures Contango Index both measure different aspects of the same phenomenon: how much current volatility readings vary from future market volatility estimates. I do believe that when estimates of near-term and long-term volatility show a record degree of divergence, some considerable opportunities are presented. As I have spelled out in a number of instances lately, my thinking has been that the back month volatility will likely collapse in order to bring the present and the future back into line. There has been some evidence of that happening during the past two days, but I anticipate that long-term volatility expectations will continue to decline.

On a related note, VXX has made a new all-time low six days in a row and counting...

Related posts:


[source: StockCharts.com]

Disclosure(s): neutral position in VIX via options at time of writing

Friday, September 17, 2010

Hope and Depression in the Investor Sentiment Cycle

Charles Kirk of The Kirk Report has an interesting post up, The Investor Sentiment Cycle, in which analyzes the results of a recent survey he conducted in which he asked a broad group of professional investors to indicate where they believe investors are in the sentiment cycle, a graphic of which is at the bottom of this post.

I am not sure of the exact origin of the Investor Sentiment Cycle, though it was attributed to a graphic from 1998 by Westcore Funds by several sources. My guess is that the chart evolved from a similar graphic from Justin Mamis, which appeared in The Nature of Risk, published in 1991.

Given my recent discussion of the record highs in my proprietary VIX Futures Contango Index, extreme readings in the AAII Investor Sentiment survey (in the newsletter), records highs in the price of gold, record low Treasury yields, surging prices for default insurance for European credit defaults swaps (CDS), etc. it is not surprising that the #2 response to the Kirk survey was that investors are going through a period of depression. On the other hand, the S&P 500 index is now 69% above its March 2009 low, which is part of the reason that the #1 response to the survey was that investor sentiment is currently characterized primarily by hope.

While depression and hope are adjacent in the sentiment cycle, the distinction in an investor’s psyche is an enormous one. With depression, there is a concern that current conditions will likely not improve and that investment opportunities carry more risk than reward. More importantly, the is such an anxiety about the future that investors worry that about the potential for markets to deteriorate to previous low levels and perhaps even get worse than they were in 2008.

Just around the corner from depression is hope, where the outlook is still mostly cloudy with a chance of sun, but there is a widespread belief (perhaps partly wishful thinking, but grounded in some tangible signs of progress) that the bottom is behind us and continued improvements are more likely than not.

Given much of the data I have seen and written about, I believe investors are still operating under the long shadow of 2008 (and beyond), with the result that their psyche is still under the influence of ‘disaster imprinting.’ In terms of the sentiment cycle, this puts them in the depression stage. My personal perspective closer to hope than depression at this point. I understand that hope is a concept that traders should avoid, but I do think that even with all the challenges to the global economy, hope is a more appropriate place to look for investment opportunities.

When the VIX is at 22 and I can sell VIX futures (or options based on those futures) at 32, at least I have the comfort of knowing that I have a large margin of error before I have to worry about some of my trading ideas becoming unprofitable.

Related posts:


Disclosure(s): neutral position in VIX via options at time of writing

Wednesday, September 15, 2010

Sitting in for Steven Sears at Barron’s Today

Today I am the guest columnist of The Striking Price at Barron’s, sitting in for Steven Sears.

In Will Market Volatility Return to Crisis Levels? I took the opportunity to expand upon some recent themes, notably the record contango in the VIX futures term structure as indicated by the new all-time highs in the VIX Futures Contango Index, etc.

The Barron’s article talks about some of the mathematical implications of an elevated VIX, puts some important numbers in historical context, and offers some thoughts on the implications for trading approaches.

Related posts:

Previous Barron’s contributions:

Disclosure(s): none

Tuesday, September 14, 2010

VIX Futures: What Were/Are They Thinking?

Yesterday, my proprietary the VIX Futures Contango Index hit a new all-time high, indicating that investors believe very strongly that the current volatility environment is grossly underestimating what volatility will look like in the coming months, particularly in 2011. This, of course, is nothing new, as the links at the bottom of this post will attest to. It is important to note, however, that the disconnect between current volatility and the volatility levels indicated by the VIX futures suggest that investors have never had such a Panglossian outlook as they do now.

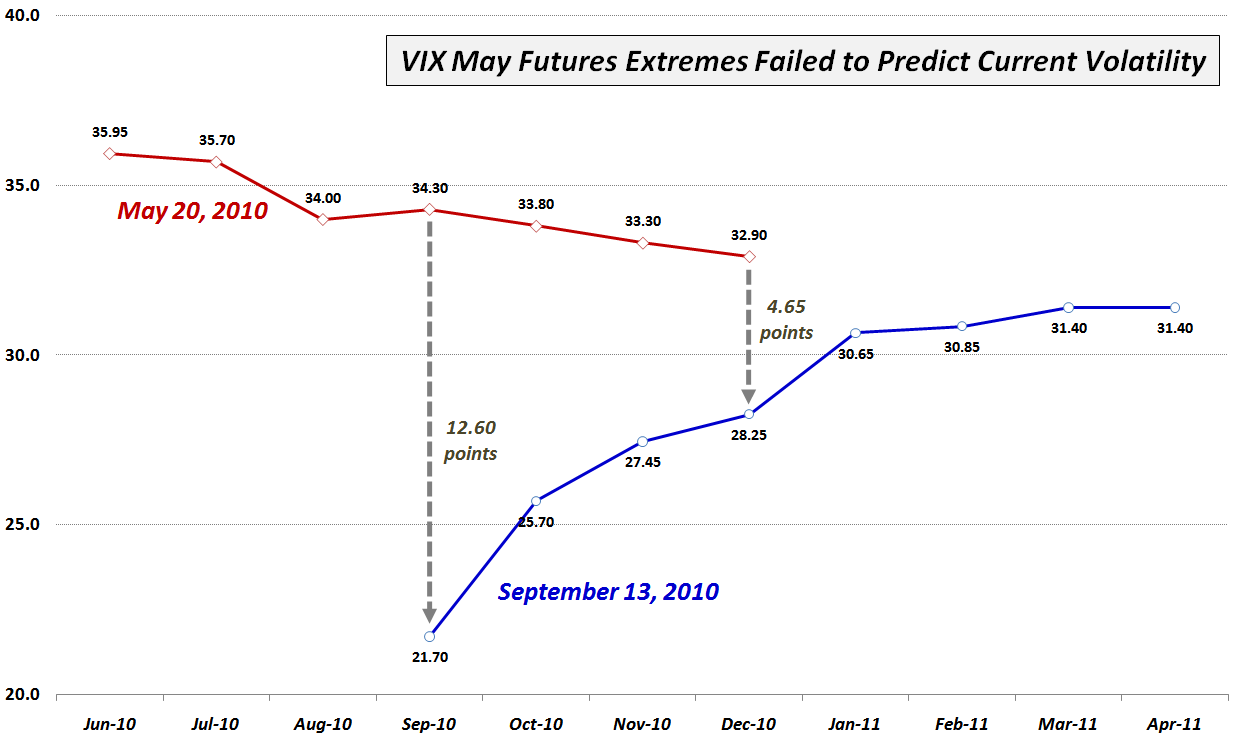
While the VIX futures may be the market’s best estimate of future volatility, these contracts are far from an ideal prediction mechanism. One only has to look back a couple of months to see how the VIX futures saw the balance of 2010 unfolding. As the chart below shows, investors were anticipating volatility on the order of a VIX of 33-36 for the second half of the year as recently as late May. The reality has turned out to be substantially different. Yesterday’s closing prices in the VIX futures reflect a downward revision to September VIX futures of 12.60 points.

I find it particularly interesting that the massive overestimation of September volatility has had so little impact on estimates of volatility for 2011. Back in May, the VIX futures were only quoted through December 2010, but if one mentally extends the red trend line formed by the September 2010 through December 2010 futures, the result is an almost identical to the current expectations of a VIX of 31 or so for February through April 2011. It is almost as if the 12.60 point miss is considered irrelevant.

If some large storm clouds do not begin to appear on the horizon in a hurry, I would expect those who are holding doom and gloom volatility positions will start to capitulate and put some downward pressure on volatility. I do not expect the record contango in the VIX futures term structure to hold up much longer. In order for the term structure to begin to flatten out and assume a more normal shape, either the back month volatility is going to collapse or the near month volatility will have to rise substantially to give credence to the expectations of doom and gloom. My thinking continues to favor the former scenario.

Related posts:


[source: CBOE Futures Exchange, FutureSource.com]

Disclosure(s): none

Wednesday, September 8, 2010

VIX Futures Contango Soars

Last week I started publishing something I call the VIX Futures Contango Index in my subscriber newsletter. The intent of this index is to enhance one’s sense of the shape of the of VIX futures term structure curve, by building on the simple math of the front month and second month roll yield calculations to come up with a mathematical representation of the degree of contango or backwardation across the entire VIX futures term structure.

Using the VIX Futures Contango Index methodology, today’s close has the index at 99.8, which is the third most extreme contango reading since VIX futures were launched in March 2004. [The index values range from 0-100, with 0 being extreme backwardation and 100 being extreme contango.]

Extreme contango readings are generally associated with turning points in stocks, which is why in the chart below, I have highlighted the two most extreme VIX futures contango readings. The highest VIX futures contango reading in the history of the VIX futures comes from April 21, 2010 and is indicated by the red arrow in the chart below. Note that this mark was achieved just two days before the SPX posted its closing high for 2010.

The second highest VIX futures reading was registered three months later, on July 21, 2010, just over one month ago. This extreme contango situation is flagged with a green arrow on the chart below, as it turns out stocks were about to move up to their highest close (SPX 1127) since the May selloff.

It is difficult to anticipate what the steep contango means for stocks this time around. Clearly the market thinks another selloff is in the cards that will drive the VIX up over 30 by the beginning of 2011. I have a less pessimistic outlook, but will be watching the VIX term structure closely to see if the level of contango is able to rise above the April high water mark.
Related posts:


[source: StockCharts.com]

Disclosure(s): none

DISCLAIMER: "VIX®" is a trademark of Chicago Board Options Exchange, Incorporated. Chicago Board Options Exchange, Incorporated is not affiliated with this website or this website's owner's or operators. CBOE assumes no responsibility for the accuracy or completeness or any other aspect of any content posted on this website by its operator or any third party. All content on this site is provided for informational and entertainment purposes only and is not intended as advice to buy or sell any securities. Stocks are difficult to trade; options are even harder. When it comes to VIX derivatives, don't fall into the trap of thinking that just because you can ride a horse, you can ride an alligator. Please do your own homework and accept full responsibility for any investment decisions you make. No content on this site can be used for commercial purposes without the prior written permission of the author. Copyright © 2007-2023 Bill Luby. All rights reserved.
 
Web Analytics