Updating the Legacy of Post-2009 Corrections
Of all the periodic themes that I update in this space, the one that always surprises me by how strong of a reception it generates is a table that I call the VIX and More 2009-12 SPX Peak to Trough Pullback Summary – of which a current version is appended below.
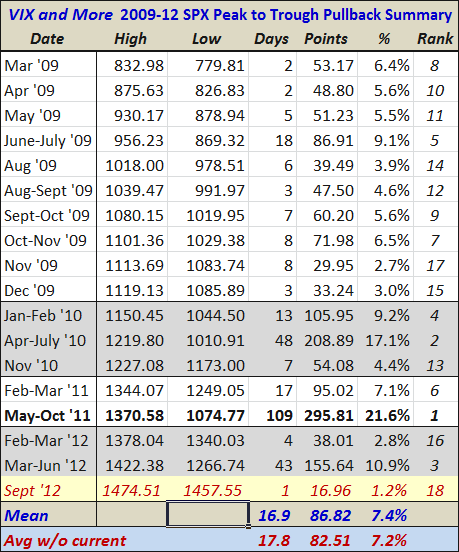
The table is a chronology of sorts of all the significant pullbacks since the March 2009 bottom in stocks. I have tweaked the definition of pullback a little so that it only includes pullbacks from new highs. For that reason, there are no significant pullbacks since the SPX made a new high for the year back on September 6th. That being said, I am including the price action of the last two days as a provisional entry in red at the bottom of the table, with data as of one quarter of an hour to go in the trading day. Generally it takes a pullback of at least 2.5% - 3.0% to warrant inclusion in this table.
I suspect that the main reason investors enjoy this table is that it gives them some historical context for how the markets have recently been pulling back and thus helps to set expectations about how far the current or subsequent correction may extend. Prior to the current mini-pullback, the median pullback was 5.6%, while the mean pullback stood at 7.4%, thanks to several sharper corrections. Applied to Friday’s high of SPX 1474, these translate to a pullback to SPX 1392 or SPX 1365, respectively. Of course, this is where the “past performance is no guarantee of future results” type of disclaimer should be inserted, but historical parameters can help to set expectations.
Factoring in the Draghi and Bernanke puts, as well as the probability and magnitude of a hard landing in China, a reversal of fortune in the euro zone, a worsening of the fiscal cliff problem, flare-ups in various geopolitical hotspots, etc. may make predicting the current direction of the market even more difficult and perilous than usual.
That being said, given the 210 point rise in the SPX in a little over three months, investors cannot be faulted for exhibiting more than the usual amount of caution during the remainder of the year.
[As an aside, I love the way pundits talk about a correction, as if to imply that the market has been wrong about a recent bullish move and it is time for cooler heads and more reasonable valuations to have their way. Certainly there is no reason why there cannot be these same type of “corrections” when markets become oversold, but good luck finding those who talk about stocks correcting upward.]
Related posts:
- A Look at the Pullbacks of the 2009-2012 Bull Market
- What If Stocks Decline?
- A VIX Risk Reversal
- Why Not Point Hedges?
- The Case for VQT
- The Year in Safe Havens
- The VIX as a Hedging Tool
- Performance of Volatility-Hedged ETPs
- Comparing SPLV and VQT
- Performance of VIX ETP Hedges in Current Selloff
- Dynamic VIX ETPS as Long-Term Hedges
- Three New Risk Control ETFs from Direxion
- The Economic Data Cliff
Disclosure(s): none

