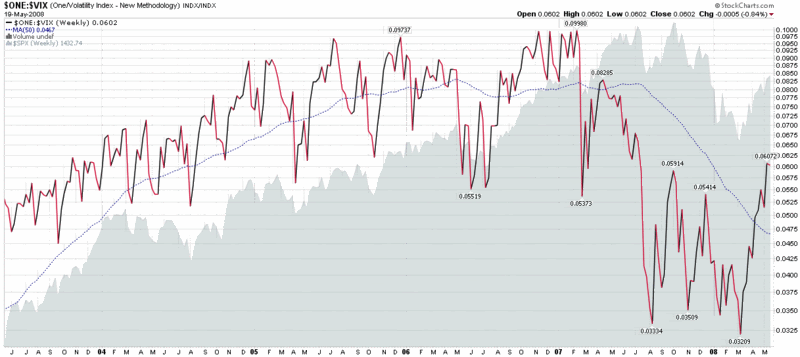
Inverted VIX: The US Tour
I have mentioned the inverted VIX on two previous occasions, most recently about 5 ½ months ago in Inverted VIX Still Bullish.
In the chart below, I continue my practice of displaying the inverted VIX in a weekly chart and looking at longer term patterns. A lot has changed on the volatility front in 5 ½ months, as evidenced by the fact that the current inverted VIX is farther above its 50 week moving average than it has been at any time since the record 64% one day spike in the VIX on February 27, 2007.
Perhaps even more interesting is that in this five year lookback period covered by the chart, current VIX levels look positively middling and unremarkable on an absolute basis, even though the VIX has come a long way in a short time on a relative basis. A new VIX floor in the 15-16 range is not unreasonable. It is higher than the new VIX floor of 13-15 I was calling for on August 1, 2007, but given all that has transpired in the markets over the past ten months, the fact that these numbers are even in the same ballpark is something to ponder.
[For more on why it is sometimes useful to turn charts upside down while analyzing them, readers may wish to check out A Different Way to Look at the VIX: 1999-2007.]


7 comments:
Bill,
For the close on Mon. 05-19, Yahoo is showing a quote for the ^VIX at 17.07, a gain of 3.64%,....
and a quote for the ^VXO at 12.86, a drop of 25.5%. This doesn't seem right. Do you have a different quote for VXO? Or, if the VXO 12.86 quote for VXO is correct, do
you know what accounts for the large disparity between the VIX
and the VXO? Probably just a data glitch on Yahoo's part. Thanks, Jim
Jim,
this will of course be an data issue. At the moment all data supplier like optionsXpress, Stockcharts, Yahoo -even the CBOE itself- show the same incorrect VXO data (o/h/l/c 17.39/17.65/9.44/12.86). I think that will be corrected tonight.
Or if correct, today would really have been a once in a lifetime event :-)
Bill: Did you receive the two emails that I sent you a few hours ago including a visualization of the distribution of all real VIX values since 02/01/1990 (showing a almost perfect lognormal distribution) ?
Best regards
Frank
Frank,
Thanks so very much. The CBOE site just posted their 05-19 end of day values, and they have VXO at 12.86 as well. It will be interesting seeing if this value gets changed.
http://www.cboe.com/data/mktstat.aspx
Thank you again for the reply.
Regards, Jim P.
VXO devotees are confused by today's close. VXO did apparently trade down as shown on this 5 minute chart. And it traded down with ESM8 which is counter-intuitive for me.
http://img2.freeimagehosting.net/uploads/31a4241350.gif
Interesting stuff.
I'm looking at a 1 minute intra-day chart of the VXO and it shows some strange activity to the downside starting just after 3:15 ET, with the VXO dropping steadily from the high 16s all the way down to 9.55 over the course of about 20 minutes. The index then bounces back up to 12.86, with no data after about 3:53 ET.
It looks like a data malfunction, as the VIX, VXD and VXN were all moving in the opposite direction of the VXO values during this period.
Cheers,
-Bill
P.S. Frank, I got the notes and replied directly to that email address. Thanks for the image.
Bill,
None of the other CBOE data I use show anything out of the ordinary, so I am going to assume for the moment it was a computer error of some kind. For now I'll use VIX today with a note to check further over the next few days.
I like your inverted VIX study very much. I do note that whereas most of the major bottoms of prior years had inverted VIX making a "higher low" at a lower price low, this "sentiment divergence" did not happen in March 2008.
@all,
the CBOE at least adjusted the VXO close from 12.86 to 16.68 a few minutes ago (in their CBOE Daily Market Statistics only; CBOE's classic quote page still shows the incorrect values).
I think the low (9.44) will be adjusted shortly as well.
Best regards
Frank
Post a Comment