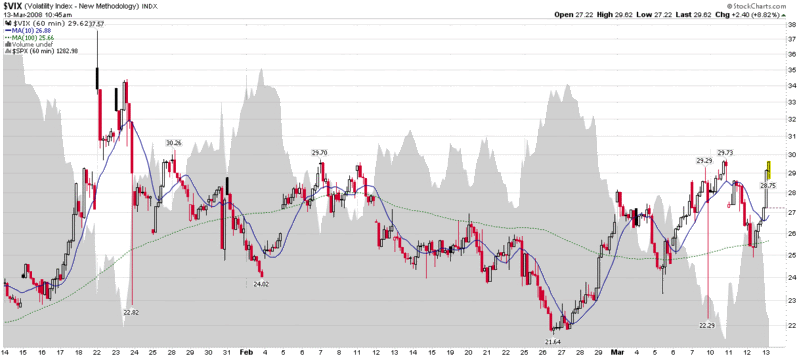
Short-Term Triple Top in VIX?
I'll be the first to admit that calling tops and bottoms is more of a parlor trick than a science, yet it is my opinion that the recent triple top in the VIX – which includes today’s spike to 29.62 – will likely turn out to be the high water mark in the VIX for the month of March.
This may sound like a dangerous prediction, but I am giving the March 11th lows a better than 50% chance of holding and am somewhat emboldened by the fact that when the VIX spiked to 29.62 this morning, the financials (XLF, if not BSC) were holding their ground above the lows for the day. To my thinking the financials continue to be the market’s Achilles’ heel and to the extent that XLF can keep from making new lows, the VIX is likely to see 30 as a near-term ceiling and the financially-heavy SPX and other broad market indices should be in a position to rally from Tuesday’s lows.
I would be remiss if I failed to point out that many pundits are saying that the market will not bottom until we see a VIX spike to somewhere near the 37.57 level that was reached when the markets made a previous bottom on January 22nd. There is always the risk that a consensus of opinion can lead to a self-fulfilling prophecy, but I am willing to bet against the masses on this one. That being said, it won’t take many more Carlyle Group disasters to push the market back into panic selloff mode.


9 comments:
On the heels of my post, S&P is out with an observation that "the end of write-downs is now in sight for large financial institutions."
Details in the WSJ at S&P Raises Write-Down View, But Points to Ray of Hope
Hi Bill,,
It seems the chart folks saying that all the indexes would pull up to their 13/20 ma then sell off has held up,,the next trick will be if the selloff will bounce off the trend line..Seems tea leaves are pretty good sometimes...lol
Mac
good observation. I often wonder if a VIX of 30 today is equivalent to a VIX of 30+ before the competing fear vehicles arived on the scene a year or so ago (inverse etf's). Also wonder if we ever see a 40 VIX again because of the plethora of inverse etf's.
--dowoper8tr--
Bill, any thoughts on the VIX IV's and VIX futures immediately before and after the FED's new TAF the other day? I havent looked in a while until today but looks like a big drop off in IV's from Mar to April. Vol players sensing smoother days ahead or is it just lack of trading interest in back months?
Thanks,
--dowoper8tr--
That's an inverted head and shoulders pattern on the VIX.
At the time of your post, I thought so too, but after today's spike up, I'm not so sure anymore... prognostication is tough! :)
Tough indeed, Felix. Using TA tools on derivatives is even more suspect than using them on the underlying -- and predictions based on TA get more problematic the farther removed you get from the underlying...which is why I said I'd stop making VIX predictions here :)
Bill, agree 100% with you about TA on derivatives... mathematical manipulations on numbers that are themselves mathematical manipulations -- does anyone think this makes sense? lol
That said, I do use MAs, MACD, and Bollinger Bands (at times) on my VIX charts. But I'm always aware of their limitations, and use them only in the context of showing how much the mythical 'rubber band' is stretched (mean-reversion). But when the VIX runs contrary to its mean-reversion nature for many bars, even these simple TA tools are not useful. :)
tnt
Excellent chart, Bill. I don't subscribe to StockCharts, and can only get two years of their free charts, but VIX/IRX might be even better as a panic indicator. Many investors run in panic to T Bills, and, of course the short term rate is what the FED is cutting when they are themselves have panicked.
Post a Comment