Showing posts with label GAF. Show all posts

Monday, November 30, 2009

Frontier ETFs

In yesterday’s chart of the week, I looked at three ETFs with exposure to the Middle East:

  • Market Vectors Gulf States ETF (MES)
  • Wisdom Tree Middle East Dividend ETF (GULF)
  • SPDR S&P Emerging Middle East and Africa ETF (GAF)

It is a little known fact that Middle Eastern ETFs are actually subset of a relatively new class of ETFs called frontier ETFs. Many of these frontier ETFs are single country ETFs, but two in particular stand out as diversified frontier plays:

  • PowerShares MENA Frontier Countries Portfolio ETF (PMNA)
  • Claymore/BNY Mellon Frontier Markets ETF (FRN)

I list PMNA (holdings) first because it is not a global, but a regional ETF, based on the NASDAQ OMX Middle East North Africa Index. At present the fund has a strong emphasis on the Persian Gulf and should be considered as a slightly more liquid (but still relatively illiquid) alternative to MES and GAF, trading approximately 10,000 shares per day. As of last week, the top country allocations were in the United Arab Emirates (22.6%), Egypt (20.2%) and Kuwait (16.9%).

In contrast to PMNA, FRN (holdings) has taken a much broader and more geographically diversified global approach, without a particular regional emphasis. Specifically, the ETF is designed to track the Bank of New York Mellon New Frontier DR Index. As of September 30, the top country allocations were Chile (28.6%), Poland (15.9%) and Egypt (15.4%).

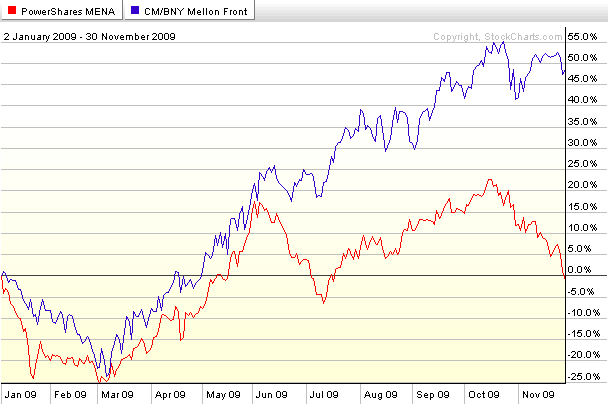
The chart below shows that the while PMNA and FRN were very similar in terms of performance for the first five months of 2009, the more diversified FRN had been a much stronger performer during the latter half of the year. Not surprisingly, given PMNA's exposure to the Persian Gulf, the gap has widened significantly during the last few days.

In addition to these multi-country frontier ETFs and regional frontier ETFs such as Market Vectors Africa (AFK), it is important to keep in mind that there are many single country ETFs available, with an increasing amount of geographical diversity. Just last week, the first Poland ETF (PLND) was launched. For investors who are interested in single country Middle Eastern ETFs, Van Eck is planning to launch new ETFs for Egypt and Kuwait.

Finally, consider that frontier ETFs are likely to appeal only to investors who can tolerate high levels of risk. The multi-country and single country variants suffer from low liquidity and high volatility, making it unwise to build up large positions until trading volumes increase dramatically from current levels.
[source: StockCharts.com]

Disclosure: none

Sunday, November 29, 2009

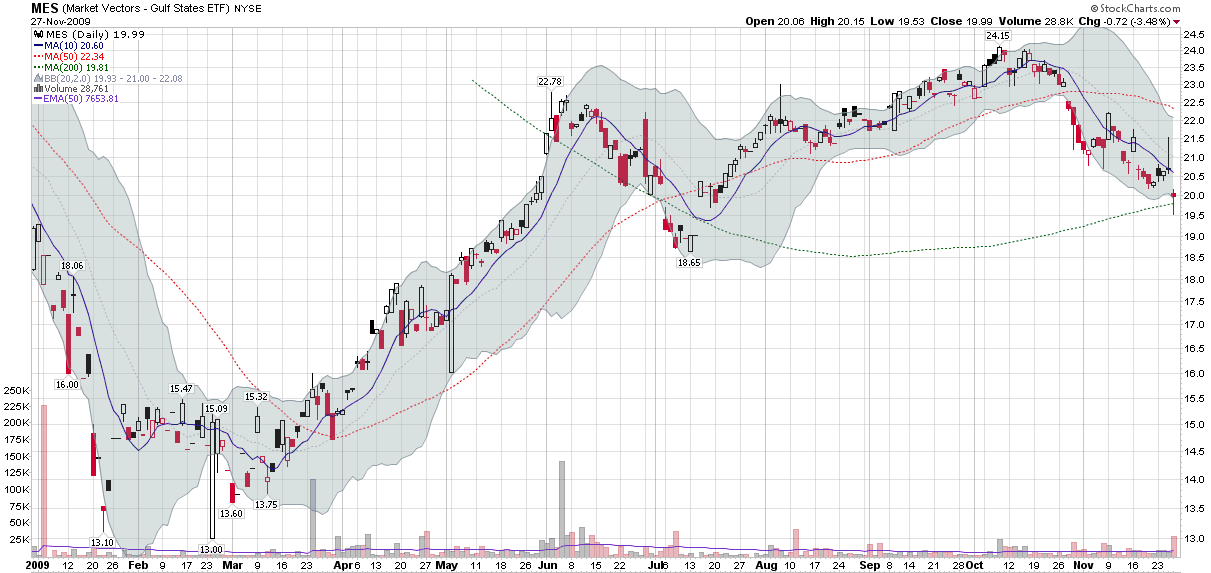
Chart of the Week: Market Vectors Gulf States ETF (MES)

With all the hoopla over the Dubai debt situation, I am surprised that there has been so little talk about Middle Eastern ETFs in general and ETFs with exposure to the United Arab Emirates (UAE) in particular. Part of the reason for the lack of mention is surely that there is little to choose from; the other problem is a lack of liquidity and investor interest to date. Only two ETFs with strong Middle Eastern exposure warrant mentioning: the Market Vectors Gulf States ETF (MES); and the Wisdom Tree Middle East Dividend ETF (GULF.) Neither of these ETFs is particularly liquid (neither traded over 30,000 shares on Friday) and both have managed to avoid detection by all but the most adventuresome ETF investors.

A third ETF that sometimes gets throw into the mix is the SPDR S&P Emerging Middle East and Africa ETF (GAF.) While GAF trades an average of more than 50,000 shares per day, it is important to understand that this is largely a South African investment at the moment. As of September 30, this ETF had 62% of its assets invested in South Africa, 24% in Israel, 7% in Morocco and 6% in Egypt. Notably absent are positions in the likes of the United Arab Emirates, Kuwait and Qatar.

Between MES and GULF, I have a slight preference for MES as an opportunity to gain exposure to the United Arab Emirates, which is why I have included MES as this week's chart of the week below. At the end of September, MES (holdings) had a 25.5% exposure to the UAE, the second highest country concentration behind a 47.7% investment in Kuwait. By contrast, GULF (holdings) had a 17.5% exposure to the UAE at the same time, which ranked second to Qatar at 30.5%.

In my opinion, there is not sufficient liquidity in either ETF to warrant any sort of trading strategy or large positions at this time, but I would not be surprised to see one or both begin to generate some more impressive volume numbers in the coming week and perhaps open up some new opportunities.

[source: StockCharts.com]

DISCLAIMER: "VIX®" is a trademark of Chicago Board Options Exchange, Incorporated. Chicago Board Options Exchange, Incorporated is not affiliated with this website or this website's owner's or operators. CBOE assumes no responsibility for the accuracy or completeness or any other aspect of any content posted on this website by its operator or any third party. All content on this site is provided for informational and entertainment purposes only and is not intended as advice to buy or sell any securities. Stocks are difficult to trade; options are even harder. When it comes to VIX derivatives, don't fall into the trap of thinking that just because you can ride a horse, you can ride an alligator. Please do your own homework and accept full responsibility for any investment decisions you make. No content on this site can be used for commercial purposes without the prior written permission of the author. Copyright © 2007-2023 Bill Luby. All rights reserved.
 
Web Analytics