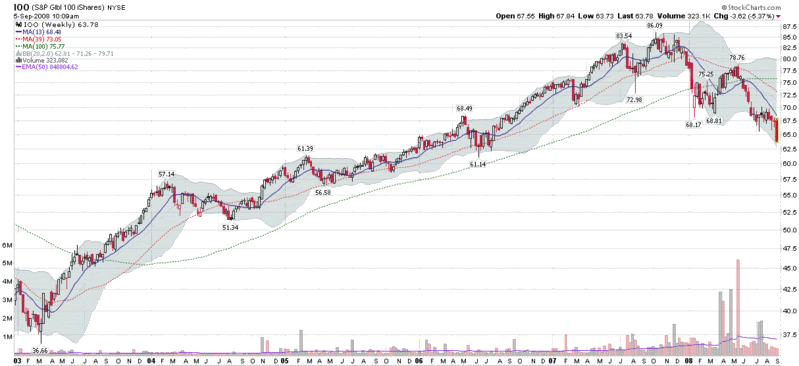
Global Equities Falling Through Support
The U.S. markets may look ugly right now, but the global picture is even worse. Pull up a chart of the South Korean KOSPI if you really want to see an ugly market.
For an ETF with global perspective, I am a fan of the iShares S&P Global 100 Index ETF (IOO), which is comprised of 100 large cap (average $10 billion) multinational companies that are selected based on the firm’s percentage of foreign assets, revenues, and employees. For more details, check out the S&P 100 holdings.
As the weekly chart of the IOO shows, the deterioration in the global equity picture has accelerated dramatically this week, with stocks falling through technical support and bringing the IOO back to levels not seen since July 2006. If IOO cannot hold the 2006 support level of 61.00, then another even uglier leg down is certainly a distinct possibility.

[source: StockCharts]


2 comments:
Personally I look at the BBC 30 Global Index now and then. 30 companies from a wide range of industries and countries. http://newsvote.bbc.co.uk/2/shared/fds/hi/business/market_data/stockmarket/29954/twelve_month.stm
Heads up. This 'bailout' just triggered $1.47 TRILLION in Credit Default Swaps on Fannie and Freddie.
The clowns that wrote these CDSs are probably dead. No way this is spread out enough over the entire system to avoid at least some implosions...
Fannie and Freddie: CDSs, $1.47 Trillion Triggered
Post a Comment