New Highs and New Lows for Market Timing
The McClellan Summation Index, the subject of yesterday’s market sentiment post, examines the difference between advancing and declining issues to help divine the future direction of the markets.
Today I am going to make the leap from daily advances and declines to daily new highs and lows covering a trailing 52 week period.
Before I dive in, I want to highlight the consistently excellent work of Headline Charts, a blog that regularly addresses issues such as advances and declines, new highs and new lows, as well as other market sentiment metrics. Today is no exception, as Headline Charts examines the ratio of new highs to new lows as well as the rarely seen inverse ratio, new lows to new highs.
I have also recently had the benefit of reading the encyclopedic and aptly titled market breadth tome, The Complete Guide to Market Breadth Indicators: How to Analyze and Evaluate Market Direction and Strength by Gregory L. Morris. This is obviously a labor of love and an indispensable resource for thinking not only about market breadth, but indicators of all types. Think of it more as a reference book than something to curl up with and you can get a better sense of its ideal application.
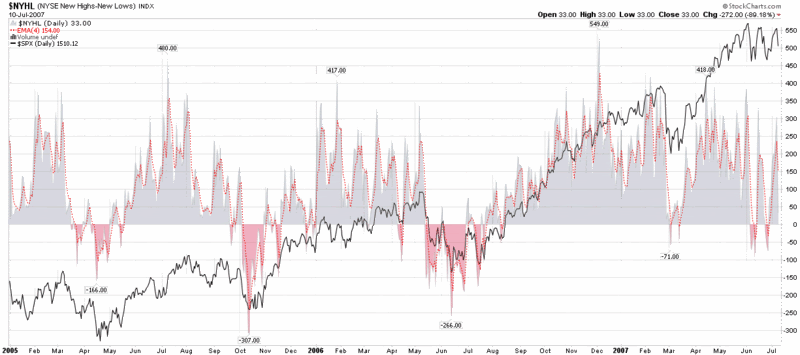
Spurred on by Morris’ research and analysis, I have been evaluating a number of market breadth indicators and am currently favoring a rather simple one for the intermediate term: new highs minus new lows, with a 4 day EMA smoother. One simple rule is to be long when the EMA is positive and short when it is negative. You can use a longer EMA or a SMA to smooth out the values a little more and cut down on whipsaws, but I like the 4 day EMA and will be adding this indicator to my short list of favorites.
You will note that the new high – new low indicator is currently recommending a long position in the markets, with a considerable cushion before it is likely to reverse.