Current Pullback Is Fourth Largest Since March 2009
With the futures on a bullish trajectory following President Obama’s State of the Union speech, this seems like an opportune time to reflect on the 67 point (5.9%) fall in the S&P 500 index over the course of the last six days.
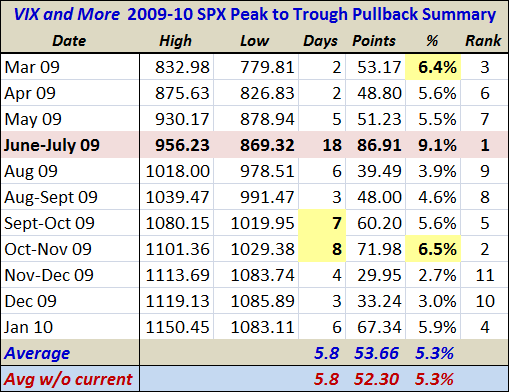
The table below – which I have been updating periodically over the course of the last five months – establishes the current pullback as the fourth most severe in percentage terms of the 11 pullbacks of 3.0% or more since stocks turned bullish in March 2009. When I first published the pullback table some five months ago, I was surprised by the strong positive feedback I received and by the volume of subsequent requests I had to update the table. It turns out that investors are very much interested in putting each pullback in historical context, specifically in knowing the magnitude and duration of each significant peak to trough move.
Thinking in those terms, based on today’s low of 1083.11, the current pullback is the fourth largest in peak to trough magnitude as well duration. By all measurements the biggest pullback was 9.1% over the course of 18 trading days during June and July of 2009, which I have highlighted in red and bolded. I have also highlighted in yellow the #2 ranked pullback from October-November 2009 as well as the #3 ranked pullbacks in terms of magnitude (March 2009) and duration (September-October 2009).
In terms of interpretation, the current pullback is certainly above average, but still a good distance from challenging the 9.1% leader or the 10% pullback that many pundits are calling for. For the record, a 9.1% pullback would put the SPX back at 1045; a 10% retracement would bring 1035 back into play. I expect we will see at least one 10% pullback before the year is done, but this appears to be an event that will reward the patient and not the anxious.
For more on related subjects, readers are encouraged to check out:
- Pullback Surpasses 2009 Mean
- Charting the Selloff with an Andrews Pitchfork
- The SPX and an 85 Day Moving Average
- Chart of the Week: Reverse Engineering a Critical Moving Average

Disclosure: none

