Monday, April 30, 2007

CNBC Million Dollar Portfolio Challenge: #1047

I have moved up to #1047 out of 1,438,436 contestants, putting me in the top 0.08%, but have suffered a couple of small disappointments since Friday’s update.

The first disappointment was the inability of NetLogic Microsystems (NETL) to hold their early gains on Friday. The stock was up 14% in the early going, bet ended the day with only a 3.5% advance. The second disappointment was entirely of my own doing. I had expected that Wright Medical Group (WMGI) would report before the close today and it now looks like I jumped the gun there. This was my screw-up, as I failed to confirm the anticipated timing of the earnings announcement before placing the trade. It is possible that this Texas-based company may report before the bell and give me some much needed volatility, but that is looking increasingly unlikely as the day wears on.

The silver lining, if there is one, is that the WMGI trade, which is down about 1.5% at the moment, may have saved me from jumping in to ICICI Bank (IBN), which is down over 7% at the moment. IBN, an Indian bank, and Kookmin Bank (KB), a South Korean bank up 2% so far today, were the other two finalists in my daily search for earnings volatility.

Getting back to horns, J. J. Johnson (pictured above) is probably the greatest jazz trombonist who has ever lived. His collaborations with fellow trombonist Jay Winding are legendary and would be an excellent first stop for anyone interested in checking out Johnson’s talents.

Necrology Update

Last week it was Rostropovich; this week it’s Kevin’s Market Blog. It’s tough when your favorites pass on. Fortunately, in Kevin’s case he’s still with us; he’s just moving on to better things in the non-blog world.

The good news is that each departed friend in my blogroll creates room for a new one in my self-imposed limit of 32 blogs. As such, I’d like to formally welcome the most recent additions to the VIX and More blogroll:

  • Toro’s Running of the Bulls – pointed commentary, superb graphics, and a wide-ranging list of targets

  • CXO Advisory Group – thought-provoking stock market research you won’t find anywhere else

  • Infectious Greed – Paul Kedrosky’s perspectives on investments, the VC world, and everything in between

  • Yaser Anwar – like Kevin, Yaser manages to strike the perfect balance between the a fundamental, technical and informational perspective on investing

Sunday, April 29, 2007

Strong Earnings at RKT Lift Portfolio A1

Strong earnings at Rock-Tenn Co. (RKT) helped propel the company to a 14% gain on Thursday, before a CSFB downgrade trimmed the stock price 4% on Friday. RKT’s weekly gain of 8.6% now makes it the top performer in the portfolio (up 24% in a little less than two months) and has helped to increase Portfolio A1’s advantage over the benchmark S&P 500 index to 6.8%.

It is worth noting that while four of the five holdings continue to sport double digit gains since being added to the portfolio, WCG’s lackluster week dropped it in to the red. Some analysts have expressed concern about WCG’s medical loss ratio; continued insider selling probably has done little to reassure investors.

There are no changes to the portfolio for the coming week.

A snapshot of the portfolio is as follows:

VWSI Is Flat; Oakley Five Reds Isn’t

The VIX continued its range-bound trading this week, closing the week at 12.45, up 0.38 from the previous week. In spite of some noteworthy divergence between the VIX and SPX earlier in the week, the persistent theme of post-2/27 subsidence in volatility now has the VIX Weekly Sentiment Indicator (VWSI) back to an even zero once again.

(Note that in the above temperature gauge, the "bullish" and "bearish" labels apply to the VIX, not to the broader markets, which are usually negatively correlated with the VIX.)


Wine pairing:
I have yet to encounter a California red blend for under $10 that I prefer to the 2003 Cline CellarsOakley Five Reds. The 2003 vintage is a blend of 41% syrah, 27% zinfandel, 22% petite sirah, 10% alicante bouschet, and 1% mourvedre. These are five powerhouse varietals and the resulting blend can stand up to – and improve upon – just about any culinary match you wish to put it up against. If you want some more detailed tasting notes, check out what others have to say about this wine on CellarTracker. Regarding some of the other wines produced by Cline, I have had mixed results, though they do an excellent job of providing a range of choices at affordable price points.

As a side note, a previous mass market red blend, Red Truck, was sold by Cline to an investor group in late 2005. Cline is a minority investor in the new Red Truck venture and will continue to the supply the syrah, cabernet franc and mourvedre grapes for the Red Truck blend. Go ahead and try Red Truck too, but my recommendation is to check out the Oakley Five Reds first.

Previous inexpensive Rhone blend recommendations include Robert Hall’s Rhone de Robles and Tablas Creek’s Cote de Tablas Blanc, as well the contrarian favorite, Wrongo Dongo.

Friday, April 27, 2007

The VIX on Mondays After Options Expiration

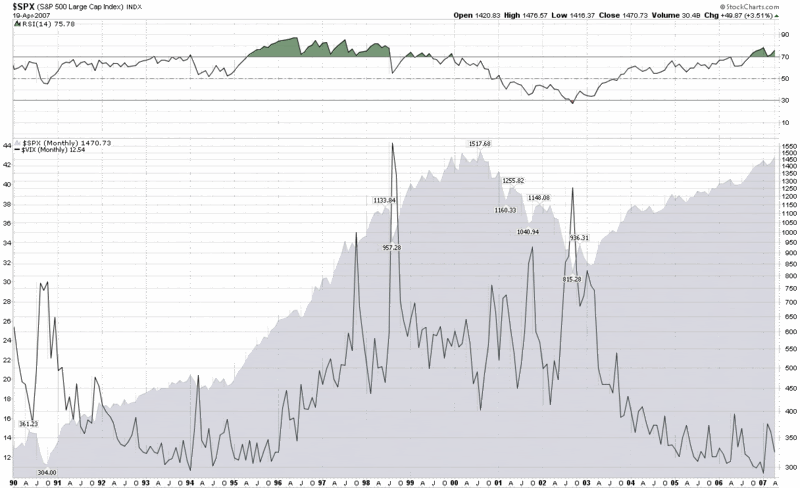
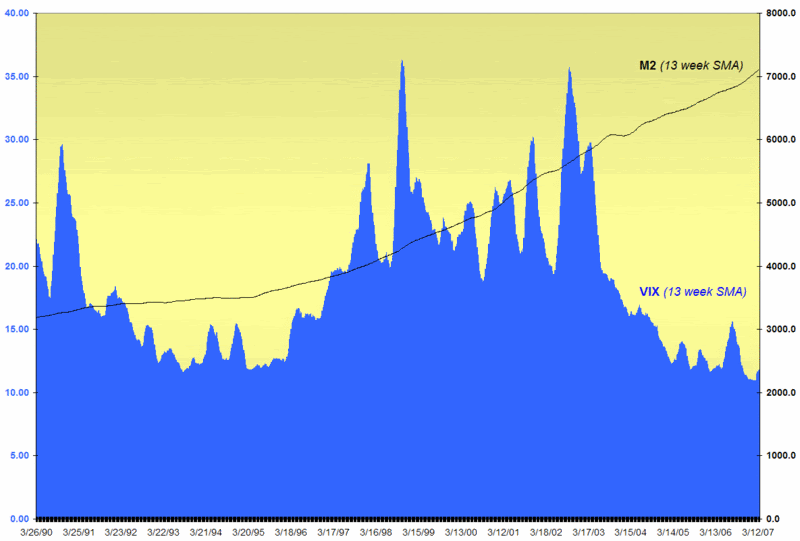
A reader asked me what usually happens to the VIX on the Monday following options expiration.

The short answer is that since 1990, the VIX has risen an average of 2.9% on the Monday after options expiration. Looking at all five days of the week, the VIX has posted a mean daily increase of 0.16% since 1990. If you back out those Mondays following options expiration, however, the remaining increase is a mere 0.02% per day, meaning that these post-expiration Mondays have accounted for almost all of the cumulative upside movement in the VIX over the past 17 years.

For what it’s worth, I also looked at the subset of Mondays following quadruple witching days and determined that those results were statistically identical to the other post-expiration Mondays.

One statistic that I found particularly interesting is that 80% of the VIX gains on typical post-expiration Mondays and 90% of the gains following quadruple witching expirations are, on average, reversed in the course of the next three days. So the next time you see a post-expiration bump in the VIX, expect that by the following Thursday almost all of the move will have evaporated.

For more on the VIX action on Mondays, Fridays, and during the options expiration cycle, click on the appropriate label links at the bottom of this entry.

CNBC Million Dollar Portfolio Challenge: #1280

You would think that a nice 2.2% gain (thank you GSIC) in addition to maxing out on the $3000 ‘bonus bucks’ trivia winnings would have served me well on a day in which the markets were essentially flat. That was not the case yesterday, as the AMZN bus rolled past me – just like the BIDU bus has done today – and I ended up dropping 20 places to #1280. One of these days, I need to catch a ride on that bus…

Thanks to these gains, my portfolio was up to $1.73 million coming in to the trading day, still good enough to keep me in the top 0.1% of the 1,382,297 contestants. It looks like I could be moving up a little today, perhaps even in to the top 1000, as I have all my chips on NetLogic Microsystems (NETL), whose positive earnings report has the stock up 7% at the moment, down from a 14% advance earlier this morning.

On the horn front, if old mono recordings of Dennis Brain are not your thing, try the more modern recordings of Barry Tuckwell. As luck would have it, he is responsible for what may be the second best recording of the Mozart Horn Concertos, but one that benefits from 1990 recording technology. In addition to the Mozart works, there are many other excellent Tuckwell recordings to choose from, including The Art of Barry Tuckwell, which is pictured at the right.

Thursday, April 26, 2007

Divergence, History and Tells

Some interesting things have been happening in the VIX this week. Yesterday, I recounted how the VIX jumped 8% on Monday while the SPX was almost flat. By the end of the day yesterday, the SPX was up 1% and the VIX, which has generally been strongly negatively correlated with the SPX, was up .6%.

In the upside down world of the VIX, any time the SPX and the VIX are positively correlated, we have a divergence. In this case I think it may be a significant divergence.

First, some quick history: from 1990 through 12/18/03, the SPX gained 1% or more on 480 occasions. Of those 480 occasions, about 12% of the time the VIX was up on that day instead of down. If you have just recently started paying attention to the VIX, as I have, that 12% number may sound high. In fact, since 12/18/03, we have had 57 additional instances of a 1% SPX jump and not one of those rises in the SPX was accompanied by rising VIX – until yesterday.

Now one data point does not necessarily mark a turning point, but it certainly is the bookend to 41 months of a very persistent pattern. In fact, if you calculate the likelihood of a .120 batter going 0 for 56, you will see that it happens less than 0.08% of the time.

CNBC Million Dollar Portfolio Challenge: Top 0.1%

OK, so I didn’t buy Amazon (AMZN) before their earnings report and missed an opportunity to log an ‘easy’ 27% gain yesterday. I still made up some ground, however, with a more than respectable 2.9% gain in VECO.

My portfolio is now up to $1.69 million, but with tenth place in the CNBC Million Dollar Portfolio Challenge at $2.93 million, the task ahead continues to be a formidable one. On the plus side, at #1260 out of 1,324,502 contestants, I can at least claim to have made it into the top 0.1%.

As this contest has progressed I have discovered the need for an earnings spike potential algorithm and have spent some time testing and refining such a beast. Yesterday, before the close, it kicked out three companies with a high potential to spike after they reported earnings after hours. The good news is that the algorithm (which I will be glad to talk about after this contest is over) produced three highly volatile plays for today: SWKS (up 21% a little after noon EDT); HLIT (down 15%); and ARBA (down 9%.) Of the three, I looked hardest at SWKS and ended up passing on this one, as well as the other two. The potential for volatility was certainly there, but I was concerned that it was more likely toe be in the wrong direction. Instead, I went with a slightly less volatile play that has been showing a lot more momentum in the run up to earnings: GSI Commerce (GSIC), whose retail e-commerce solutions helped deliver a quarter that was good enough to overcome two analyst downgrades that knocked the stock down early this morning. After opening down 5.3% this morning, the stock has rallied to where it is currently trading up 4% on the day.

And now for the horn tooting portion of this post. For those who are late to the CNBC party, in the past when I have tooted my own horn here I have used the opportunity to highlight one of my favorite horn players. First up were two jazz trumpeters: Clifford Brown; and Lee Morgan. Today I want to turn my attention to classical music and Dennis Brain, who may be the greatest classically trained horn player of the modern era. If you are not sure whether you are a fan of classical music, you owe it to yourself find a way to introduce your ears to Brain’s 1953 rendition of the Mozart horn concertos. If this turns out to be a transformational experience in your life, don’t say I didn’t warn you.

Wednesday, April 25, 2007

The Unusual VIX Activity of April 23rd

A reader asked for my opinion on the unusual action in the VIX on Monday, April 23rd in which the VIX was up 8% while the SPX was down only 0.2%. If you follow the link above, you can see that my relatively unconsidered response pointed at three potential factors which might have had a larger effect on the VIX than the SPX.

Two days later, I am going to stick to my initial reaction, with a couple of minor elaborations. The one additional factor that looms much larger in retrospect is the fear associated with the real estate market crashing in Spain, as well as potential spillover into the banking sector and into other geographies. I wish I had a better explanation, but I don’t. I am posting my thoughts here in hopes that some readers can weigh in with their theories.

  1. The Friday to Monday VIX problem is "a collision of the trading week and the calendar week" in which trading and calendar time is synchronized during the trading week, but becomes uncoupled on weekends and holidays. On Monday, time is re-synchronized and volatility spikes to mark the event.

    This phenomenon is described by Adam Warner in a comment on this blog when I was first grappling with this issue; you can also check out a related thread at Elite Trader. Better yet, read Alan Lightman’s delightful Einstein’s Dreams to get an appreciation for how time warps and bends its way through our lives.

    For an academic perspective on the Friday to Monday VIX phenomenon, I refer you to A Tale of Two Indices by Peter Carr and Liuren Wu, whose weekday effects analysis is on page 10. A quick eyeball of the charts shows that the typical price jump from Friday to Monday is in the 2.0 to 2.2% range.

  2. A much less important factor, but one I still think is worth pointing out, is that volatility usually rises the week after options expiration. I discussed this phenomenon early on in the life of the blog, but should return to this theme for follow-up at some point.

  3. My guess is that with a combination of VIX implied volatility having dropped dramatically during the past two weeks and the broader markets on an impressive winning streak, several indicators were flashing overbought signals and the VIX looked like cheap portfolio insurance once again.

Some quick back of the envelope analysis give us 2% for the Friday to Monday calendar problem, another 2% for the 0.23% drop in the SPX (I have the VIX at a current beta of -8.34, so 0.23% * 8.34 ≈ 2%) and perhaps 0.5% (a SWAG) for the week after options expiration week and I can account for about a 4.5% spike in the VIX for Monday. That leaves another 3.5% to be accounted for by Spanish real estate, cheap portfolio insurance and other factors.

If nothing else, perhaps Monday’s action will provide Bill Rempel with more fodder for his “error term” analysis.

Movin’ On Up

As of last night, I have moved up to #1565 in the CNBC Million Dollar Portfolio Challenge. With 1,273,430 contestants in the running, it appears I will need to pass another 292 to make it in to the top 0.1%. If that happens, I’ll set my sights on the top 1000, then maybe…

My reality check is that tenth place is currently at $2.89 million, safely ahead of my $1.64 million war chest.

As I described yesterday, I rode AKS up after their strong earnings report, but the stock ran out of steam late in the day and finished with a 4.2% gain for the session. Of course I dumped AKS at the end of the day and elected to put my chips on Veeco Instruments (VECO) – a nanotechnology equipment company with a focus on the semiconductor industry. VECO has had a difficult year, lowered guidance for the most recent quarter, and delivered some lackluster numbers last night. Still, strength in their MOCVD business has brightened the outlook somewhat and helped push the stock up 2.5% this morning.

For the record, I recognize that Amazon (AMZN), which is currently trading up 20%, was the obvious earnings play last night, but my thinking is that if you are trying to beat the crowd, you increase your chances dramatically by getting off the beaten path. I can only hope that when it comes to Amazon at least, my competition is thinking along the same lines…

Tuesday, April 24, 2007

CNBC Million Dollar Portfolio Challenge: Top 0.2%

This seems to be as good a time as any to provide an update on my dalliances in the CNBC Million Dollar Portfolio Challenge. At the moment, I stand as #2091 out of 1,246,562 contestants – my best showing to date. While I am delighted to be sporting a 57% return and have so many contestants in my rear view mirror, I decided a week ago that each day I would put all my chips on a particularly volatile stock in hopes of maximizing my chances for reeling in those who are ahead of me.

As you can see from the trades outlined below, my goal is to maximize volatility in my portfolio more than it is to pick winners. In the process, I have developed a system for picking potential earnings spikers that I will be glad to provide some more details on when the contest is over. In the meantime, I will be the first to acknowledge that skill is not a significant element in this contest, unless you consider it a skill to be able to develop a portfolio that will have a week to week volatility of at least 25%.

Here is a recap of what has transpired in the past seven trading days.

I started my single stock approach by tempting fate with an ‘all in’ bet on Vertex Pharmaceuticals (VRTX) on Friday the 13th. It looked like a disastrous move when VRTX traded down 6% before the market opened on Monday and opened off more than 5%. Fortunately, VRTX rallied slowly over the course of the day, finishing down only 0.8%. I was impressed by the reversal, held on for another day, and was rewarded with a 5.9% gain. I made the mistake of holding one more day, however, watched VRTX drift sideways, and dumped it at the end of the third day.

In my worst move and only losing trade of the contest so far, I rolled the dice on earnings AMC Wednesday. EBAY looked like the obvious high flier trade, so I went against the crowd and went all in on NVLS, losing 5.8% of my portfolio and negating the gains from VRTX.

Thursday night I sold NVLS and hopped on the OO express. Oakley turned in a great quarter in terms of both revenues and earnings, raised full-year guidance, and saw their stock jump 11.7% the next day.

By Monday morning, I was back at the earnings roulette wheel, with all my chips riding on Arch Coal (ACI) – and they handily beat expectations, trading up over 7% at one point during the day and finishing the day up 4.4%.

Today looks to be an even better day for my single stock ‘portfolio,’ as AK Steel (AKS) turned in another strong earnings report, pushing the stock up 5.8% as of this writing.

I still think it will take a portfolio of at least $3 million to make it to the top ten and get a pass into the finals. Assuming I can hold on to today’s gains in AKS, that means it will take a minimum return of 22% per week (compounded) over the last three weeks to put me in the ballpark. That type of performance is not impossible, but time is becoming a a more significant obstacle each day.

If my good fortune continues, I will provide more frequent updates…

Monday, April 23, 2007

ISEE SMA 50 Double Bottom?

The nice thing about a 50 day simple moving average is that it is a lot easier to guess where it might be going than a number that starts with a blank slate each day. With the 50 day SMA, for instance, you can start by looking at the numbers that are going to be scrolling off of the 50 day time horizon used for the calculation, then assume they are going to be replaced numbers similar to the ones currently being printed and…voila: you can tell the future at least as well as the next guru.

In the case of the ISEE, it was not that difficult for me to gaze into the future on March 28th and discern that the ISEE 50 day SMA would be flashing a buy signal for the entire month of April, which is exactly what has happened. While it may be a little harder to predict the future right now, my educated guess is that April 16th is going to turn out to be the second half of a double bottom in the SMA 50, with the first half coming back in October.

One amazing statistic that partly explains why the SMA has trended so low in April is that since January, the ISEE has closed above the lifetime mean of 154 on only one day, when it posted a 156 back on February 16th. Today’s ISEE reading has been slowly trending up all day and sits at 139 of this writing. Looking at today’s numbers and data for the past week, it appears that investor sentiment is moving away from extreme bearishness and back toward the relative complacency that the VIX has hinted at.

Even with the possibility of a double bottom, the ISEE call to put ratio remains at a level that is historically associated with several months of continued bullish activity in the broader markets, as the chart below demonstrates. As more bears grow tired of fighting the trend, they could help to fuel the next leg up.

Sunday, April 22, 2007

After Two Months, Portfolio A1 Is 5% Ahead of the S&P 500

Now that has been two months since Portfolio A1 was launched, I feel that sufficient time has elapsed to begin taking a cursory look at some of the portfolio statistics.

The first statistic that jumps out at me is annual turnover. While many may see a 327% annual turnover rate as high, this portfolio is designed to be actively traded, with the potential for turnover as high as 2000-3000% per year. So far, the system has culled three of the original five holdings. Of those three, only RIO has been a high performer since it was dropped from the portfolio. On the other hand, the post-sale performance of NTY and PCCC has been middling at best. So it appears that the system is doing a good job of cutting free losers – and I have no problem erring on the side of doing this too soon rather than too late.

In terms of the stocks that have been retained, four of the five current portfolio holdings are up at least 13% to date. The laggard, WCG, is up 2%, but it has only been two weeks since it was added to the portfolio. Again, this is just the type of performance I am looking for.

From a risk perspective, I look at maximum drawdown, which is the maximum peak to trough drop, regardless of time period. In the case of Portfolio A1, the 2/27 correction resulted in a 13% drawdown from the 2/26 high – a period during which the S&P 500 lost a little over 6%.

Though it is not included in the calculations on this graphic below, individual stock betas and correlations are an important component of portfolio risk. Four of the five stocks have betas in the 1.2 to 2.2 range; the fifth, AMKR, currently has a beta of about 5.0, which is partly responsible for why the current weighted average beta of the portfolio is 2.6. With the increased passage of time, I will look to the Sharpe Ratio as a means of measuring risk-adjusted returns.

Of course, total return and active return (defined as total return minus benchmark return, with the benchmark being the S&P 500 in this case) are two numbers that I keep a very close eye on. I am pleased to report that Portfolio A1’s return of 7% for the first two months is 5% better than the 2% return logged by the S&P 500.

There are no changes to the portfolio for the coming week.

A snapshot of the portfolio is as follows:

VWSI at +1; More Gewurztraminer Ideas

For the second week in a row, the VIX notched its lowest weekly close since 2/27, ending the week at 12.07, down slightly from a close of 12.20 the previous week.

The lack of movement in the VIX has dropped the bullish bias in the VIX Weekly Sentiment Indicator (VWSI) from a +3 level last week to the current reading of +1. At this stage of the game, it would take a sub-11 reading in the coming week for me to see a risk/reward profile favorable enough to consider opening a long position in the VIX.

(Note that in the above temperature gauge, the "bullish" and "bearish" labels apply to the VIX, not to the broader markets, which are usually negatively correlated with the VIX.)


Wine pairing: Last month I talked about two dry gewurztraminers from California as the perfect pairing for a VWSI of +1. I would be remiss if I didn’t praise the Old World ancestors of California gewurztraminer, the elegant Alsatian gewurztraminer. Unfortunately, Alsatian gewurztraminer is not distributed as widely as the quality of the wine warrants, so you probably won’t have many options at your local wine store. I would suggest you remember three names: Trimbach, the most widely distributed; Hugel, another winery with strong distribution; and Domaine Weinbach, a winery whose profile seems to be on the rise, and with good reason, based upon several stunning wines I have enjoyed in the past year or two. All three producers are excellent choices for gewurztraminer, riesling, pinot blanc, and pinot gris. To get a better sense of these wineries and the wines of the region, check out some reports by Lettie Teague and Robert Whitley.

Friday, April 20, 2007

The SPX and the VIX Revisited

Several readers have inquired about whether the markets can continue to make new highs if the VIX is well above its all-time low. My answer is a resounding “Absolutely!” Frankly, I would expect new highs in the broad market indices to only rarely correspond to new lows in the VIX.

I present my thinking below, but before I get into the details, let me pose a question. Assume I tell you that I have had a glimpse of the future and can guarantee that in 2050 the SPX will be trading at 100,000. Now I ask you to guess what the VIX will be when the SPX hits that milestone. What did you guess? 10? 11? My guess would probably be 18 or 19, as the mean daily close of the VIX since 1990 currently stands at 18.95. For the record, that 100,000 number is not all that outrageous either, as it represents 'only' a 10.1% CAGR, which is consistent with historical rates of return.

The big problem here, as I discussed in some detail in “The SPX:VIX Relationship” is that we are attempting to compare one number that trends about 10% a year over the long-term with another value that oscillates around a mean of about 19.

Let me pull up a monthly chart of the SPX and the VIX going back to 1990 to illustrate my point (click for a larger image; also feel free to disable the Snap preview function with a click on the upper right hand corner of any previewed image if you so desire):


Look closely at the period from October 1994 through March 2000, which, of course, was a raging bull market in which the SPX increased by a multiple of about 4.5x and made hundreds of new all-time highs. What many may not realize is that the VIX was moving up steadily during this period as well, going from the 12-14 range to the mid-20s. In fact, one should expect that given the oscillating nature of the VIX, there will be many bullish periods where the VIX actually goes sideways or rises. Only during extreme bullish complacency should we expect to see VIX readings in the 11-12 range and sub-10 may turn out to be a once a decade phenomenon. Said another way: there is a fairly strong possibility we will not see a sub-8 VIX this century, yet by the end of the century there is a good chance that the SPX will have something like 39 digits in it.

One other factor to consider about the current state of the VIX and market indices is echo volatility, which I have spoken about at length here in the past. While some who may be buying stocks may feel like the big volatility spike is behind us, others, like my dog, are firm believers in volatility clusters – and with good reason.

In summary, time horizons are important, but it is even more important to know when you are comparing trending numbers with oscillating ones. For one potential resolution to the SPX-VIX conundrum, you might wish to take a look at my previous posts on the SPX:VIX ratio.

Thursday, April 19, 2007

The Importance of Time Horizons

Tim Price at The price of everything has an excellent post up today with the title, “It’s About Time...” In it, he quotes Jim Leitner of Falcon Management as saying (in Inside the House of Money: Top Hedge Fund Managers on Profiting in the Global Markets) that “If all investors allocate money to a one-month time frame, by definition there are going to be fewer opportunities there...There’s just too much competition over short-term trading, which is a timing-driven business. With timing, sometimes you’re going to be right and sometimes you’re going to be wrong, but it’s not going to be consistent over time. Meanwhile, the longer-term opportunities still exist because there hasn’t been that much money allocated with multi-year lockups. That’s not happening yet and probably won’t because investors are way too nervous and shortsighted.”

I talked a little about time horizons in A Sentiment Primer, and will have more to say on the subject at a later date, but I today want to note that I don’t believe Leitner picked the one month time frame for his hypothetical out of thin air. Given that the SPX is a real-time pricing measure, the VIX looks out 30 days, and VIX options extend all the way out to the middle of 2008, this presents an interesting context in which to think about risk and reward.

Later in the same article, Prices cites Nicholas Nassim Taleb (whose Fooled by Randomness is required reading for all VIXophiles) as the source for the statistic that the day trader’s portfolio has a 50.17% chance of improving for each minute that the frenetic trader checks the balance, while the long-term investor who checks his or her portfolio once a month is likely to see a gain in the period 67% of the time.

What is your time horizon? Do you always trade in the same time horizon? How good are you at matching your research, thinking, setups, entries and management of existing positions to your target time horizon? Do you know the time horizon of your favorite indicators? Do they suit your trading style and typical holding periods?

I'm not sure about the answers to all these questions, but I wanted to pose them as a thought experiment. I will kick them around a little more and weigh in again at some time in the future.

Wednesday, April 18, 2007

1 + 1 = 1987?

Though this blog is ostensibly about volatility, I try not to inject too much of the perma-bear melodrama into what I write, but I would remiss if I didn't point to some alternative opinions from time to time.

Take two posts I just happened upon.

Libby Mahalka of Financial Pragmatist has a nice review of the divergence between risk as measured by the VIX and the shrinking risk premium available in the bond markets, as evidenced by credit spreads.

Meanwhile, Barry Ritholtz at The Big Picture looks at a big picture of 2007 vs. 1987.

Now put these two ideas together...

For the record, I'm not hitting the panic button. I don't even have my hand near the button. Instead, I prefer to take my cues from what the market is actually doing rather than what I think it might do. Then again, it is always good to know how some others in the market are thinking about potential future scenarios.

First Annual VIX and More Blog Disclaimer Awards

After the events of yesterday, I decided to add a disclaimer to the blog. I consider it some sort of small victory that I was relatively comfortable being disclaimer free for three months, but after a brief meeting with legal (my wife), I decided to state formally what should be acutely obvious to everyone who reads anything on these pages.

So I got to wondering how other bloggers have tackled this issue. It turns out that most have a disclaimer whose content seems to be a function of the legal status of the entity they write for, professional licenses held, number of months as a blogger, etc. No real surprises here. Some appear to take a fine toothed legal comb approach to the disclaimer while others appear to try to cover the bases with a broad brush stroke.

After looking at all 32 bloggers on my “Blogs I Read” list and another 100 or so whose feeds I subscribe to (if you have not yet tried Bloglines, you are really doing yourself a disservice), I am hereby announcing the winners in the First Annual VIX and More Blog Disclaimer Awards:

First Place – David Merkel at The Aleph Blog (scroll to the bottom for the disclaimer, but make sure you eventually review the even better content above it) covers all the bases succinctly, with some appropriately self-effacing prose

Second PlaceBill Rempel a.k.a. NO Doodahs!, for striking the right balance between the necessary cautions and a candid yet humorous non-legalese tone

Third Place – Ron Sen at Technically Speaking, Market Analysis and Theory, for his pithy and pointed “Educational use only. Never intended as advice.” tagline he appends to each post. Make sure to catch Ron’s consistently excellent charts and analysis, including fairly frequent commentary on the VIX.

Honorable Mention uglychart.com – for someone who excels at presenting the lighter side of investing, uglychart is all over the legal disclaimer like a first year associate. Other sites may edge him out in the word count department, but uglychart still prevails on style points. (I have no idea why uglychart is suddenly ending up on all my lists. I’ve never even had any contact with the guy…)

Winners are entitled to download the JPG of the black hole in the Circinus Galaxy above and are encouraged to do whatever they can to capitalize on any notoriety and/or commercial opportunities this award may make available to them.

Tuesday, April 17, 2007

On Risk, 'Real Money,' and the CNBC Million Dollar Portfolio Challenge

A reader wrote to say that when he read that I had bought VRTX for the CNBC Million Dollar Portfolio Challenge, he decided to follow me in that trade with money in his IRA and was interested in hearing about my next pick as well.

I was more than a little surprised to hear this, but since I do not have a disclaimer on this site (I was wondering how long I would be able to get by without one) this seems like a good time to repeat my reply here:

While I appreciate the vote of confidence, I feel obliged to note that my intent in this CNBC contest is not to build a solid portfolio in risk/reward terms, but to take as much risk as possible in order to maximize the probability that I will be able to finish in the top 10 contestants by 5/14 and thus get a shot at the $1 million that comes in the subsequent runoff.

As a result, I am betting my entire portfolio on the riskiest stocks I can find. This is something I would never do in real life -- and I know from experience that my risk tolerance is probability in the 99th percentile for the investor community, but given that there are 900,000 entrants and 10th place is already up 156% in just 6 weeks, I have no choice.

Going forward, I will not be 'investing' in the traditional sense of the word, but rather rolling the dice with the most volatile stocks I can find. After the market closes, we have earnings reports from ESLR, IWOV and STX, among others. These three stocks all have betas above 3.0, so I will likely jump on one of them in hopes of making a big move, but I would strongly recommend that someone using real money not follow a strategy like this.

I hope that disclaimer didn't sound too preachy.

FWIW, my 'real money' take on VRTX is bullish, though I'd probably be moving up trailing stops to protect profits at this point. The problem is that in terms of 'contest money' I need to double my money (at least) in the next 4 weeks and VRTX won't be able to help on that scale.

I hope this helps.

This and That (Mostly That)

Some thoughts for the VIXophile in all of us:


…and the AndMoreophile too:


Finally, some have wondered what I did about my ‘all in’ bet on VRTX last Friday for the CNBC Million Dollar Portfolio Challenge. Well, I took a beating on Friday and for the better part of yesterday, but when it rallied to almost fill the gap late yesterday, I decided to hold on rather than jump into an earnings play, so my patience is being rewarded today. My thinking was along the lines that I always look very closely at the second day of price action after announcements of FDA decisions or key clinical data for biotechnology companies; I saw yesterday's reversal as an opportunity not only to confirm a 15 month low, but signal the 10+ million short shares that it was time to cover. While I may make a little money today, I am not closing the gap on the leaders and time is becoming my enemy. Now it looks like it is time to roll the earnings dice

Monday, April 16, 2007

The Battle for Bond ETF Supremacy

Over the weekend, there was an interesting MarketWatch.com article, "In come more bond ETFs: Vanguard enters wide-open market as Barclays throws out the 'junk,'" about the battle for bond ETF supremacy between Barclays (BGI) and Vanguard, with BGI landing the first few punches. Two items in particular caught my interest:

  1. BGI's launch of the first high yield ETF, the iShares iBoxx High Yield Corporate Bond Fund (ticker HYG); and
  2. the very low 0.11% expense rates for the Vanguard bond ETFs

Specific to VIX, volatility and risk, I can see future applications involving the use of a high yield ETF with a government long bond ETF like TLT to look at ratio charts (unfortunately, StockCharts.com does not yet have HYG in their database,) price differential charts, etc. This type of analysis might turn out to be a good complement to the Markit Credit Default Swap data.

Looking more at the “…and More” side of the ledger, here are a handful of ETF-related links that I get a lot of value from:

Finally, while the bond ETF field is already getting crowded, I thought I might point out a half dozen ETFs that have consistently high volume and consequently are as appropriate for trading as they are for longer term investing:

  • SHY - iShares Lehman 1-3 Year Treasury Bond Fund
  • IEF - iShares Lehman 7-10 Year Treasury Bond Fund
  • TLT - iShares Lehman 20+ Year Treasury Bond Fund
  • AGG - iShares Lehman Aggregate Bond Fund
  • LQD - iShares iBoxx $ Invest Grade Corp Bond Fund
  • TIP - iShares Lehman TIPS Bond Fund

Lowest Open for VIX Since 2/26/07

The VIX opened at 11.86 today, the first time it has opened below 12.00 since 2/26.

For those who may be interested, I will initiate a small long position in the VIX if it trades down to 11.16 at any point today. The VIX is currently trading at 11.52, a little bit above the 11.47 intra-day low.

Sunday, April 15, 2007

Portfolio A1 Continues Solid Performance

Four of Portfolio A1’s five holdings – all but WCG, which was purchased on Monday – can now claim double digit returns. As WCG (WellCare Health Plans) has been a top performer in the red hot health care sector, the current composition of this portfolio looks as strong as it has been since the launch eight weeks ago. During those 8 weeks, Portfolio has gained 4.4%, while the benchmark S&P 500 has declined 0.2%.

There are no changes to the portfolio for the coming week.

A snapshot of the portfolio is as follows:

VWSI at +3

After several weeks at zero, the VIX Weekly Sentiment Indicator (VWSI) is once again showing a directional preference with the current +3 reading. For those who may skip the fine print below the graphic, this means that I am officially neutral, but borderline bullish, in the direction of the VIX over the course of the next 1-4 weeks. Without trying to sound like a two-handed economist, this also means that history and statistics are on the side of the VIX moving up from these levels, but that the edge is not significant enough to warrant my taking a long position in the VIX at this time.

Also, while I use the VWSI as a trading signal for trading the VIX and not the broader markets, it is still reasonable to interpret the a VWSI as suggesting that the markets are likely to trade sideways to down in the next few weeks.

For the record, the VIX needs to drop another point or so next week before I would start buying calls.

(Note that in the above temperature gauge, the "bullish" and "bearish" labels apply to the VIX, not to the broader markets, which are usually negatively correlated with the VIX.)


Wine pairing:
For a VWSI of +3, I recommend a sauvignon blanc. Traditionally the primary white wine varietal of Bordeaux, sauvignon blanc floundered for years in the US as “the other white wine grape” for those who decided they needed an occasional break from chardonnay. Robert Mondavi began calling sauvignon blanc by the name of fumé blanc in 1968 and helped to increase the prestige and awareness of the varietal to some extent, but also created considerable confusion among the largely unsophisticated American consumers of the era.

In the 1980s, sauvignon blanc experienced a renaissance with the help of innovations in New Zealand that involved fermentation in stainless steel tanks instead of the traditional oak barrels and resulted in a refreshing, fruit-forward wine that bore only a passing resemblance to the lemony, grassy efforts that were common in the US. In the last two decades, the fruity stainless approach has come to dominate much of the new production and has helped to restore the reputation of the varietal and dramatically increase demand and acres planted.

Thom Elkjer offered up a summary of the recent history of sauvignon blanc in his “The Many Faces of Sauvignon Blanc” article in the San Francisco Chronicle back in 2004. His assessment still holds up well today. Elin McCoy provides a current evaluation of the grape, along with some suggestions, in “Food-Friendly Sauvignon Blanc Wine Sheds Its Underdog Status.”

In terms of a specific recommendation, you might as well start with a Marlborough sauvignon blanc from New Zealand from the winery that played the biggest role in kick-starting the Kiwi sauvignon blanc revolution: Cloudy Bay.

Friday, April 13, 2007

I’m Moving ‘All In’ on VRTX

Well…kind of. Specifically, I am putting all $1.4 million that I have in my CNBC Million Dollar Portfolio Challenge portfolio into Vertex Pharmaceuticals.

My thinking is that while I am still somewhat pleased to be listed in the top 1% of contestants, each day the top 10 contestants widen the gap between my steadily growing portfolio, which is gaining about 3% or so a week, and their vast fortunes. As of this writing, I now find myself more than $1 million away from making it in to the top ten list.

The catalyst is coming tomorrow, when Vertex will present some new clinical data on telaprevir (VX-950,) a promising Hepatitis C drug, at a conference in Barcelona. Depending upon what is presented, the fallout with likely have a dramatic effect on the stock price of VRTX, whose calls currently have an implied volatility of about 78.

Adam Feuerstein of TheStreet.com did an excellent job of sizing up the situation for Vertex and telaprevir in February. Earlier today, 24/7 Wall St. summarized the options play on Vertex and talked about it as a potential “next Dendreon.”

As I see it, I probably need to make at least another $1.5 million, probably more, in the month remaining just to have an outside shot of finishing in the top ten. Ironically, this is not necessarily a desperation play on my part. If ten or more other people make bigger bets on VRTX than I do and the stock soars, then I’m that much farther out of the money. So…in this strange world of stock market competitions where high risk trumps good portfolio management skills, VRTX is both an offensive and defensive play on my part.

Looking ahead, if there is good news on Saturday (and Monday), I’ll increase the level of transparency on my thoughts and actions in this contest a little. If not, then I’ll put this subject on the back burner and move on to other subjects.

Thursday, April 12, 2007

VIX May OTM Calls

Once again, Jim Kingsland of The Kingsland Report is talking about significant buying activity in OTM VIX calls, this time the May 19s. You may recall the last time he made a similar observation and I commented on it here that is was only a couple of days before all hell broke loose on the VIX front.

This time around it feels a lot different from where I sit. The last time I could sense The Coming Storm and was surprised only that it took so long before it finally arrived. This time my intuition is tuned to things like the put to call ratio and is telling me not to worry, so I am more likely to be on the selling end of those May 19 calls. The problem is that my intuition, which is generally right about 51% of the time, is not as good at sniffing out a VIX spike as that of Jim Kingsland or not-so-random Roger Nusbaum. That's okay, though. It gives me something to work on while I watch the time decay on those May 19s.

Bloglines and the Information Waterworks

Not too long ago, a fellow blogger wondered about how I was generating so much content. Obviously, he doesn’t get around to as many blogs as I do or he would have pointed a finger elsewhere...but maybe that’s the point.

He had a couple of theories that I am somewhat reluctantly republishing here:

  • you are a white-collar criminal serving time for securities fraud, writing from prison
  • you are a real-life Rain Man savant, writing from a mental hospital, "defi-defini-defi-defi-No Deal Howie..."
  • you are a secret Wikipedia project: you're not a single person, but a collective of anonymous contributors writer under a common pseudonym
  • you're a speed-freak plagiarist, frantically copying and pasting from sources I've just haven't got around to reading
  • you're a Vatican finance old-timer with a terminal illness, cramming for sainthood

Before I talk a little about my process, let me officially respond to his list of possible explanations.

I am not (yet) in prison for securities fraud, never was a fan of Wapner, do not believe in the wikiBorg, and have long since parted ways with the Vatican. On the other hand, I have always believed that KMart sucks, have an unusual talent for doing complex math gymnastics in my head, and confess to a minor linking fetish. I am also somewhat binary, believing that it is better to do something 100% or not do it at all. Putting in 50% effort is usually a waste of my time. It helps that this subject (VIX and sentiment) is new to me and brings a freshness and passion that I would not get rehashing some of my well-trodden investment paths. I do like to write -- and I haven't done much more than PowerPoint bullet points for the past decade or so.

Back to the process…

Ironically, one of the reasons for my starting a blog was to have a convenient place to find all my favorite links. del.icio.us, while an interesting tool, just never captivated me. The “Blogs I Read” section of my blog has gone through several iterations. Originally it was a list of sites that I found had information that was most valuable to my trading. As time wore on, it evolved to include mainly blogs that update their content at least once per day and gave me some good insight into specific areas of interest (e.g., options, energy, market sentiment, etc.) I capped my list of favorites at 32 only because that is the number that fits neatly on to the screen of my primary monitor. The problem was that some of the most treasured content was being updated on an irregular basis and I was having an internal debate about how to allocate those 32 slots to content that was refreshed regularly and therefore sometimes had a shorter mental gestation period versus some of the gems that seemed to sprout occasionally from those who post only once or twice a week. Well, I was damned if I was going to have my full blogroll require any scrolling and yet the dilemma of regular content and irregular gems (along with the many 'dry holes' when I click on the links) was making me reconsider the entire venture.

Long-time bloggers and RSS/Atom aficionados are probably scratching their heads wondering why I didn’t just subscribe to feeds to solve my problem. Well, while I may have been an alpha geek in 1989, I haven’t been nearly as techno-savvy over the past few years, so I dragged my feet.

The solution turned out to be Bloglines. I must say that Bloglines has enhanced my enjoyment of the web more than any other application than I can recall using this decade. For those who are still unfamiliar with subscribing to feeds or for those who already have feeds and are looking to optimize your experience, the two obvious options are Bloglines and Google Reader. For what it is worth, I went from constantly clicking on 32 web sites that were usually not updated to getting all new content on one page, with all photos, charts, etc. Now I spend less than half the time I used to in this process, capture the feeds of over 100 web sites, and never have to worry about missing out on the gems. I urge you to try both products and decide which one works better for you.

Some links to get you started:

Wednesday, April 11, 2007

Some Mid-Week Links

A collection of recent posts that I am still chewing on, still chuckling about, or both:

VIX Implied Volatility Falls Below Pre-2/27 Level

The last time I mentioned the widening gap between the VIX's implied volatility and historical volatility, IV stood at 85, well below the average IV reading for the past year. In the two weeks since that post, IV has fallen all the way down to 75, which is now below even pre-2/27 levels, as the graph below demonstrates.

I am not sure what to make of this other than to observe that we appear to be entering another period of meta-complacency. Though the VWSI is not flashing a signal to buy the VIX yet, this does look like it might be a good time to start nibbling.

Tuesday, April 10, 2007

Volatility and Liquidity: A First Look

I must admit that when Milton Friedman died last November, it was the first time that I stopped to think about the money supply in several years. Of course, I hadn’t really given any thought at all to the VIX at that time and starting a blog was just about the furthest thing from my mind...

Fast forward five months and I find myself thinking about all three subjects.

Looking back, from July 2006 to February 27th there was a constant drone about how global liquidity had all but snuffed out volatility; and with some interesting comments cropping up on VIX and More this morning (thanks to 'F'), it seems like time I turned at least some attention to the subject, even if I do so with a substantial knowledge deficit.

Fortunately, Agustin Mackinlay has a blog dedicated entirely to global liquidity issues and I have spent a little time in the past hour or two reading up on the US money supply. For those in need of a quick refresher on the money supply, Wikipedia has a good overview and Anna Schwartz has an excellent article and links. Quicken has a Money Supply for Dummies quickie for those without ego issues and The Ludwig von Mises Institute has an interesting perspective.

If you are not content with broad brush strokes and prefer a more in depth examination of some of the important money supply issues, I can recommend the following:

That’s should help with the background.

As for analysis, I pulled out my trusty Excel data and looked at M2 and the VIX from 1990 to the present. It doesn’t tell me much, but I include the graph here for those who may be interested.

With a little more maneuvering, I was able to get a VIX chart to match the 2003-2007 chart of the (reverse engineered) M3 money supply measure and have included it below. More analysis is needed, but the eye can discern some sort of inverse correlation between M3 and the VIX during the past four years.

I will certainly return to this subject at some point in the future, but for now I encourage any lurking monetarists and others with thoughts on liquidity and volatility to chime in.

Monday, April 9, 2007

When Is Echo Volatility Safely Behind Us?

Over the weekend, a reader asked an interesting question, “What day following 2/27 would you have been as comfortable as possible that the volatility index could not or would not sustain its pace?”

My knee jerk answer was that 20 trading days is the magic number for determining whether echo volatility has run its course or if the VIX is entering a period of sustained volatility. A simple test is whether the close on day 20 is below the close on the day of the VIX spike or even below the 10 day SMA.

As March 27th marked the 20th day since the 2/27 spike, the fact that the VIX had dropped 26% from the 2/27 close should certainly provide considerable comfort for those wondering whether the VIX is likely to spike back into the 20s soon.

A look at the chart I posted last Thursday confirms that following the 2/27 spike, the price action in the VIX has been the weakest yet by historical standards. In looking at that same graphic, however, the conclusions about the previous eight VIX spikes are not so obvious.

In this morning’s research project, I examined all nine VIX one day spikes of over 30% (which includes available data for the 2/27 spike) and looked at the close on the day of the spike, 5 days out, 10 days out, 15 days out and 20 days out. I then compared these to the VIX closes on days 30, 40, 50 and 60 in order to determine if any of the five day increments added meaningfully to the ability to predict VIX levels down the road. One conclusion surprised me a bit: the first ten days tell you very little about future VIX prices that you don’t already know by just applying ‘normal’ VIX mean reversion tools to the close on the day of the spike. By day 15, it is possible to predict future VIX price levels with considerably more accuracy and by day 20 I would say that I am “as comfortable as possible” about making predictions about future VIX levels and the possibility of more echo volatility. Of course, your comfort may vary...

Keep in mind that one of the golden rules of VIX mean reversion is that if mean reversion does not play out over the course of 10-20 days, then we are likely headed for a period of extended volatility. Given the events and numbers that have fallen out of the post-2/27 spike, history says that we are more likely to see the VIX back below 11 before we see it in the 20s again.

DISCLAIMER: "VIX®" is a trademark of Chicago Board Options Exchange, Incorporated. Chicago Board Options Exchange, Incorporated is not affiliated with this website or this website's owner's or operators. CBOE assumes no responsibility for the accuracy or completeness or any other aspect of any content posted on this website by its operator or any third party. All content on this site is provided for informational and entertainment purposes only and is not intended as advice to buy or sell any securities. Stocks are difficult to trade; options are even harder. When it comes to VIX derivatives, don't fall into the trap of thinking that just because you can ride a horse, you can ride an alligator. Please do your own homework and accept full responsibility for any investment decisions you make. No content on this site can be used for commercial purposes without the prior written permission of the author. Copyright © 2007-2023 Bill Luby. All rights reserved.
 
Web Analytics