Volatility and Liquidity: A First Look

Fast forward five months and I find myself thinking about all three subjects.
Looking back, from July 2006 to February 27th there was a constant drone about how global liquidity had all but snuffed out volatility; and with some interesting comments cropping up on VIX and More this morning (thanks to 'F'), it seems like time I turned at least some attention to the subject, even if I do so with a substantial knowledge deficit.
Fortunately, Agustin Mackinlay has a blog dedicated entirely to global liquidity issues and I have spent a little time in the past hour or two reading up on the US money supply. For those in need of a quick refresher on the money supply, Wikipedia has a good overview and Anna Schwartz has an excellent article and links. Quicken has a Money Supply for Dummies quickie for those without ego issues and The Ludwig von Mises Institute has an interesting perspective.
If you are not content with broad brush strokes and prefer a more in depth examination of some of the important money supply issues, I can recommend the following:
- The Fed decides to stop reporting M3 data
- Macroblog thinks the M3 data issue is not a big deal
- Barry Ritholtz thinks otherwise
- The Capital Speculator comments on the increasing growth in M2
- The CXO Group maintains that M2 growth is not a good predictor of stock market returns
- Mish weighs in with a lengthy analysis of the money supply and recessions
- Angry Bear (aren’t they all?) points to the political/electoral context of money supply issues
- …and Nowandfutures.com has reverse engineered M3 from publicly available data
That’s should help with the background.
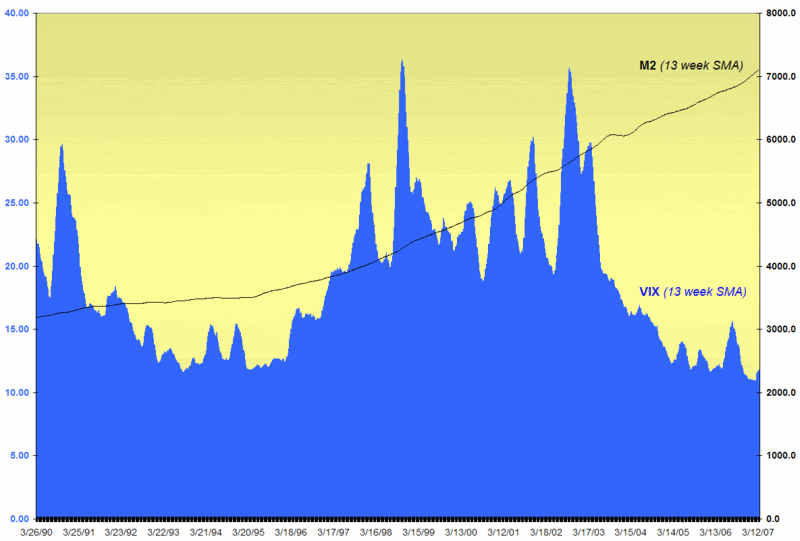
As for analysis, I pulled out my trusty Excel data and looked at M2 and the VIX from 1990 to the present. It doesn’t tell me much, but I include the graph here for those who may be interested.
With a little more maneuvering, I was able to get a VIX chart to match the 2003-2007 chart of the (reverse engineered) M3 money supply measure and have included it below. More analysis is needed, but the eye can discern some sort of inverse correlation between M3 and the VIX during the past four years.
I will certainly return to this subject at some point in the future, but for now I encourage any lurking monetarists and others with thoughts on liquidity and volatility to chime in.


