Showing posts with label pairs trading. Show all posts

Friday, December 14, 2012

Apple and Yahoo! Moving in Opposite Directions (Again)

Over the years it has not been difficult to find charts in which Apple (AAPL) and Yahoo! (YHOO) have been moving in opposite directions. In fact, just make a chart of any random time frame and it’s a good bet that AAPL will be rising and YHOO will be falling.

For the last three months, however, that relationship has been reversed and it has been YHOO stock that has been on the rise, while AAPL’s fortunes have been on the wane, as the chart below reflects.

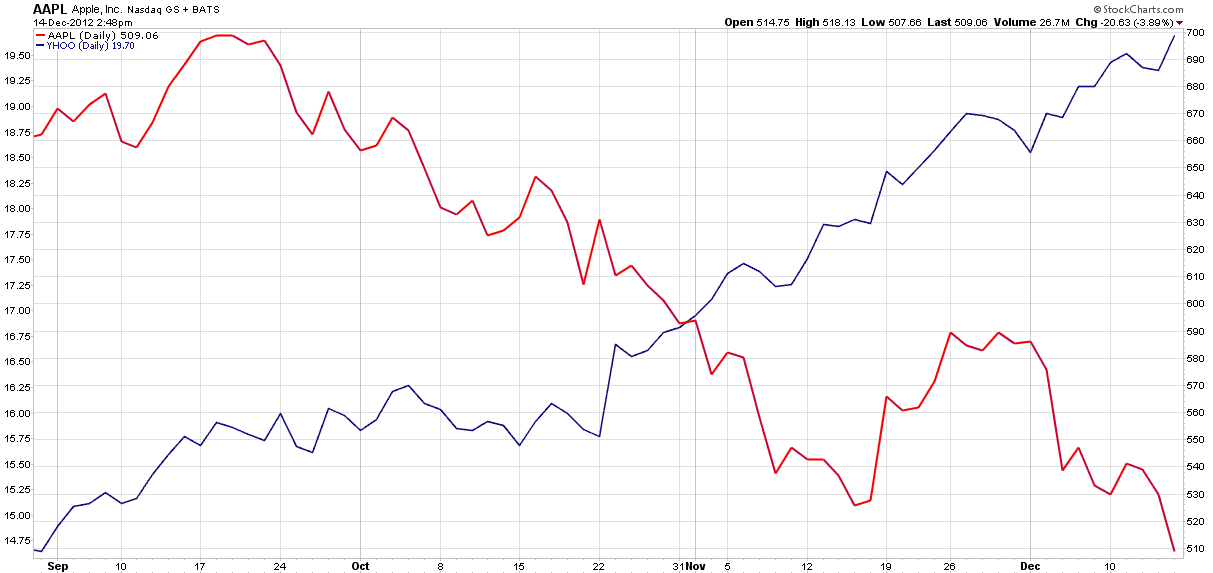
[source(s): StockCharts.com]

Part of the resurgence in YHOO is no doubt due to Marissa Mayer, the new CEO, who has already begun to put her stamp on the company and has given analysts and customers something to talk about. In fact, I searched the blog and it turns out that the company has not warranted a reference here since 2008, seemingly ready to go the way of AltaVista.

Pairs trades in the technology sector can be a rocky ride, but for those who are willing to be long YHOO and short AAPL, the potential for a big winner continues through today’s trading.

Related posts:

Disclosure(s): long YHOO and short AAPL at time of writing

Friday, August 14, 2009

Pairs Trading with ROB

While I have never written down any sort of mission statement or goals for VIX and More, my aim here has always been to bring fresh ideas, new subject matter and original graphics to an investment landscape that I find all too often overrun by the same warmed over sound bites and clichés.

Ideally, I would like to give readers a steady diet of ideas and concepts they can ruminate about and use to incorporate new thinking into their trading.

I have never been keen on trading blogs, but there are times when I should probably make a better effort to build a bridge from ruminations to trading. Yesterday’s Hermès vs. Wal-Mart is a case in point. The post generated a fair amount of feedback, including some discussion about possible pairs trading approaches for some retailing ETFs and individual stocks.

The chart below is an adaptation of the Claymore/Robb Report Global Luxury Index ETF (ROB) to Wal-Mart (WMT) ratio discussed in yesterday’s post and incorporates some pairs trading tools found in ETF Rewind, a powerful Excel spreadsheet tool and companion blog that is a sister site to Jeff Pietsch’s popular Market Rewind blog.

The chart shows the potential for a market neutral pairs trading approach using ROB and WMT that incorporates a 4 day lookback period and results in a nice smooth hypothetical profit and loss curve. [Click to view full-sized original graphic]

Readers who are interested in learning more about pairs trading or who are interested in a superb Excel spreadsheet for analyzing ETFs are encouraged to check out in ETF Rewind, which is available with a three day free trial.


[source: ETF Rewind]

Disclosure: I use ETF Rewind on a daily basis and have been so happy with it that I now offer a special annual subscription bundle consisting of VIX and More, ETF Rewind and Quantifiable Edges in a ‘Blogger Triple Play

Friday, May 30, 2008

Agricultural Commodities vs. Base Metals

I’ll be the first to admit that I am sometimes guilty of oversimplifying the commodities world by lumping all commodities together for the purpose of making broad comparisons between equities and commodities. When I break out a particular commodity, it is usually crude oil or gold.

In fact, the recent action in agricultural commodities and base metals has been at least as interesting as the action in the energy and precious metals baskets. Many of the same factors – supply and demand, inflation, geopolitics, etc. – are at work across the full spectrum of commodities. Sometimes the geopolitics of agricultural commodities and precious metals are on par with that of oil politics. Just ask the Chinese…

The chart below compares the ETFs associated with the PowerShares Deutsche Bank Liquid Commodity Index – Agriculture (DBA) with the comparable ETF for base metals (DBB) over the course of the 17 month life of the ETFs. The chart shows three distinct internal trends within the broad commodity sector: the strong metals performance for the first four months of 2007; the sharp rally in agricultural commodities relative to metals during the remainder of 2007; and the more recent (albeit less dramatic) tilting of the pendulum back in the direction of base metals.

At the moment, both agricultural commodities and base metals are struggling to hold on to gains made over the past six months. There are a myriad of ways in which to invest in commodities over the long-term or to take short-term speculative positions. When thinking about the latter alternative, do not overlook a pairs trading approach.

DISCLAIMER: "VIX®" is a trademark of Chicago Board Options Exchange, Incorporated. Chicago Board Options Exchange, Incorporated is not affiliated with this website or this website's owner's or operators. CBOE assumes no responsibility for the accuracy or completeness or any other aspect of any content posted on this website by its operator or any third party. All content on this site is provided for informational and entertainment purposes only and is not intended as advice to buy or sell any securities. Stocks are difficult to trade; options are even harder. When it comes to VIX derivatives, don't fall into the trap of thinking that just because you can ride a horse, you can ride an alligator. Please do your own homework and accept full responsibility for any investment decisions you make. No content on this site can be used for commercial purposes without the prior written permission of the author. Copyright © 2007-2023 Bill Luby. All rights reserved.
 
Web Analytics