Marty Chenard and the VIX RSI (30) [REVISED]
For those interested in charting and technical analysis, Marty Chenard of StockTiming.com has an excellent stable of charts that he uses as a jumping off point to analyze the markets. Every trading day he has a new free chart and once a week or so he manages to work the VIX and volatility into the conversation.
Unfortunately, at least for the non-subscriber, Chenard’s charts scroll off each week as they are replaced by new ones, but Headline Charts recently captured one of Chenard’s VIX ideas in a post. Headline Charts maintains that according to Chenard, markets do not advance on the basis of a declining VIX alone, but also require that the declining VIX transpire in the context of a VIX with an RSI (30) above the 50 line.
In the six month chart provided by Headline Charts, one can see that the VIX has spent very little time above the 50 line for the RSI (30) during the course of the past six months? Could this be part of the reason why the markets have had such difficulty putting together a convincing rally?
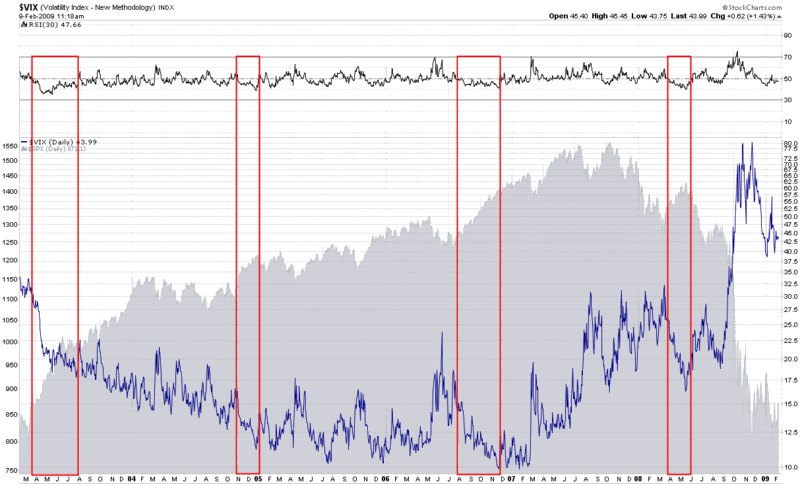
In the chart below, I go back to 2003 to take a longer view of Chenard’s VIX RSI theory. Without crunching any numbers, visual inspection already has me skeptical about the advisability of waiting for a declining VIX with an RSI above 50. I have highlighted four significant bull moves in which there was a declining VIX and an RSI (30) below 50.
I will subject the VIX RSI theory to some further testing, but at first blush I have difficulty finding support for Chenard’s VIX RSI market timing approach.
[I have decided to leave the original post up, but have added the following comments.]
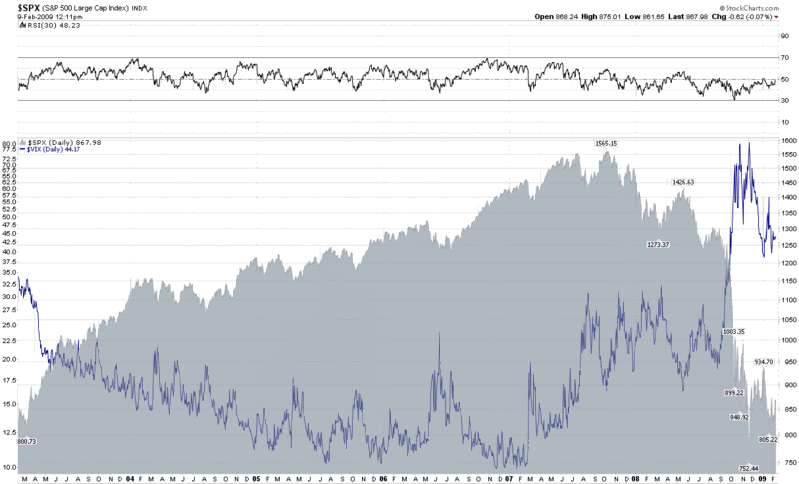
Thanks to Quantifiable Edges for giving my reading comprehension a nudge and for giving me an opportunity to have my own Emily Litella moment. In rereading the Headline Charts piece, I am now persuaded that Chenard was talking about the RSI (30) of the SPX instead of the VIX. This makes a lot more sense to me and shows much more favorably on the charts. Here is a similar chart to the one above, with the RSI (30) for the SPX instead of the VIX. Now I like his theory a lot better…
[graphics: StockCharts]




