Tuesday, July 31, 2007

Links: Play it Where it Lies

It has been almost a month since I posted my last set of links, so I am going to bend the rules a little to incorporate posts of note from the last three weeks or so that I consider to have a fair amount of enduring value and are important to have in my personal archives. At this stage in the game, most of this is not breaking news, but hopefully these links will still provide some excellent fodder for contemplation.

Going forward, if you are looking for a set of links to give you a nearly real-time snapshot of the who is thinking what in the investment world, I highly recommend you check out the excellent links provided by Abnormal Returns and Barry Ritholtz at The Big Picture.

In semi-random order:

The SPX:VIX Ratio, the Mean Reversion Magnet, and Fun With Numbers

During all the excitement of the past week, quite a few indicators printed extreme readings. One that was all over the press was the surge in new lows. Babak, Dr. Brett and Headline Charts did such an excellent job of covering this one that it hardly seems worth noting again here.

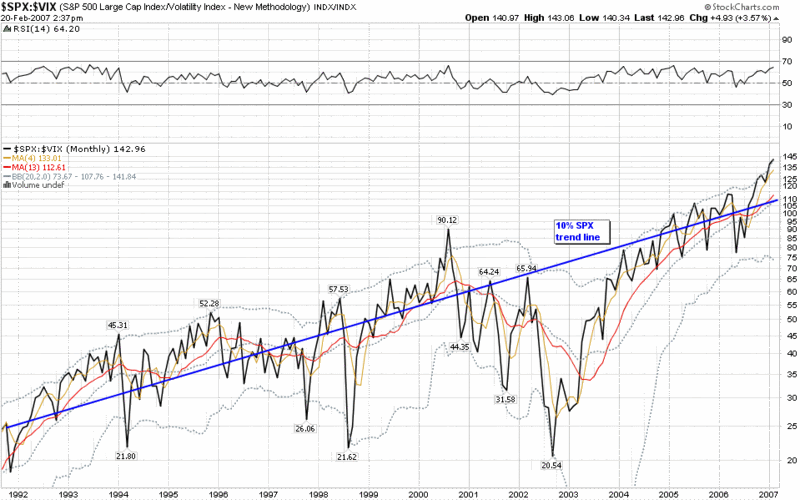
Another indicator to print extreme readings that I’m sure I follow much more closely than others is the ratio of the SPX to the VIX. I’ve written a fair amount about the SPX:VIX ratio in the past and am of the opinion that the 10% trend line (for an explanation of the 10% trend line, try “The SPX:VIX Relationship”) acts as an intermediate to long-term mean reversion magnet.

One interesting aspect of the ratio is that it does not specify which of the variables will mostly likely be responsible for moving the ratio back toward the historical trend line. Given that the VIX is much more volatile than the SPX, it is natural to assume that the VIX will make the sharper move, so with an SPX of approximately 1500 and a SPX:VIX ratio of 115 or so, this implies a VIX of 13.04. One interpretation of this calculation is that the VIX is approximately 50% ‘too high’ for the current level of the SPX. Of course, another possible interpretation is that the VIX has been ‘too low’ for much of the baseline period.

Another way of looking at the ratio is to fix both the ratio and the VIX and solve for the SPX. Assuming a VIX in the neighborhood of the current 20 value and a SPX:VIX ratio of 115, this projects to an SPX of 2300, which stretches the limits of credibility a little too far for my taste.

So…if you believe in a relatively constant long-term relationship between the VIX and a trending SPX and all the assumptions that go along with it, which of the two scenarios is more likely to bring the SPX and VIX back toward an equilibrium: an SPX of 2300 or a VIX of 13?

For the record, I do believe in the trend line magnet properties of the SPX:VIX ratio, but I am quick to note that the mean reversion magnet sometimes exerts a sufficiently weak influence that the ratio can stay out of balance for several months to at least two years, as was the case during 2002-03. As unlikely as it may seem in the context of continued volatility in today’s session, the odds favor the SPX:VIX ratio being back in the 100-120 range in the next two months – and this sets up a number of potentially interesting trades.

Monday, July 30, 2007

RUT Hedge Fund Puke?

On the off chance that there are readers out there who have not bothered to read Bernie Schaeffer’s market commentary because it requires a free registration to Schaeffer’s Research, you really should rethink that idea. Take, for instance, Schaffer’s “Monday Morning Outlook: Fear Swells Amid Market Pullback,” which was published earlier this morning. Here Schaeffer pulls a gem from Stonebrook Structured Products, a provider of hedge fund replication strategies:

“A large part of hedge fund returns are driven by shorting large-cap growth and the going long small-cap value and emerging market equity. True alpha accounts for only 20-25% of industry returns.”

Schaeffer extends this idea to come up with a hypothesis for the recent substantial performance gap for small caps (as evidenced by the Russell 2000 falling almost three times as hard as the large cap indices):

“Once the more volatile smaller-cap stocks began to seriously under perform the S&P, their short S&P hedges were not sufficiently protecting them (which caused them to be ‘too long’ in a market correction) and the hedge funds then needed to go out and sell stock from their portfolios and/or short the IWM or buy IWM puts. And all of this served to further blast the IWM.”

Interestingly, a look at the volatility of the Russell 2000 index (RVX) compared to the VIX does not reveal the underlying dynamic that Schaeffer suggested, but a study of the ratio of the IWM to the SPY does support his contention. See the two charts below for a better sense of this.

One key takeaway from this exercise is that some important volatility-related information is flying under the radar of the volatility indices. Another key takeaway is that ETFs are not only the driving the force in the markets these days, but they need to be a central part of any market technician’s analytical toolbox as well.


Hedging Volatility with CME

In the wake of the February 27th spike in volatility, I recommend going long the Chicago Mercantile Exchange (CME), now know as CME Group following the completion of their merger with the CBOT, as a back door hedge against increased volatility.

After a week of market turmoil, I noticed that Barron's is now making a similar recommendation, Business Week has described "a sea change in the way trading is done," and an AP story confirmed an ever growing bandwagon last Friday, when CME closed with an impressive 19.00 gain.

Even if volatility settles back into the mid-teens, I still think CME is a strong play, with the most recent quarterly results supporting that idea. If, however, the VIX continues with a 20 handle past Labor Day, then I suspect CME could be a much bigger winner than many on the current bandwagon expect.

Of course, regular readers will be quick to recall that predicting volatility one month out can be a humbling experience...

Sunday, July 29, 2007

Portfolio A1 Last Seen in Woodshed

While the SPX, DJIA and NASDAQ Composite all feel somewhere in the 4.0 - 4.7% range during the past week, Portfolio A1 plummeted 9.2%, dragging the portfolio’s aggregate performance down below that of the benchmark S&P 500 index for the first time in four months.

Southern Copper (PCU) was the only holding to fare better than the indices, losing 3.3% on the week. The next ‘best’ performers, Mobile TeleSystems OJSC (MBT) and Terex (TEX), fell 7.7% and 8.6 respectively. Two other holdings logged double digit losses on the week, with Amkor (AMKR) off 11.9% and Pinnacle Airlines (PNCL) plummeting 13.6% by Friday’s closing bell. Pinnacle’s performance is largely responsible for it being dropped from the portfolio and replaced by Navistar International (NAVZ), a stock I owned some 23 years ago when it was International Harvester. While the company has had some extremely difficult challenges in the intervening years, a recent $623 million contract award to the military vehicles division suggests considerable upside potential. Navistar lost only 1.0% last week and has the potential for a significant upside surprise in more favorable market conditions.

There are no other changes to the portfolio for the coming week.

A snapshot of the portfolio is as follows:

Saturday, July 28, 2007

VIX Spikes to 24.17, VWSI at -10

Thanks to an unusual 1.20 surge from 4:00 – 4:15, the VIX managed to spike all the way up to a 24.17 close on Friday, ending the week up 7.22 or 42.6%. In dollars and percentage terms, this is the type of VIX weekly move that you would expect to see only a couple of time per decade, yet this week’s action does not quite match that of five months ago, when the VIX jumped 7.99 points on a much smaller base and logged a 75.2% gain for the week.

Several readers have asked what these extreme VWSI readings mean. In a nutshell, they mean that a short-term (i.e., 5-10 trading days) VIX mean reversion move is highly likely and tradeable. While this also means that the broader markets will likely move in the opposite direction of a mean-reverting VIX, I tend to focus on the VIX play rather than the broader markets play – at least so far – in this blog.

In terms of historical context, I provided some interesting data for the week of February 27th that neatly predicted the subsequent unprecedented VIX contraction. I will expand upon this data set by offering up the only instances of an end of week VWSI of less than -6 since the shortened week of September 11, 2001:

  • week ending 3/22/07: VWSI of -10…VIX -24.3% the next week
  • week ending 5/19/06: VWSI of -9..…VIX -17.0% the next week
  • week ending 1/20/06: VWSI of -7..…VIX -17.8% the next week
  • week ending 4/15/05: VWSI of -9..…VIX -13.3% the next week
  • week ending 9/21/01: VWSI of -8..…VIX -25.2% the next week
Next week may turn out to be the exception to the historical rule, but the odds are stacked heavily against it.

(Note that in the above temperature gauge, the "bullish" and "bearish" labels apply to the VIX, not to the broader markets, which are usually negatively correlated with the VIX.)

Wine pairing: What kind of wine should you drink when volatility spikes and skewers your portfolio? A fortified one, of course! I am specifically talking about port, a wine that Americans often fail to properly appreciate. Port is a complex wine with a complex story that requires more than this small space to tell properly. A good introduction can be found in “A Port Primer Ruby,” by Steve Pitcher. To save you some lengthy research, I suggest you just go ahead and sample something in the $15 range, preferably Fonseca Bin #27 and/or Graham’s Porto Six Grapes. If either of these is a hit, then you should probably sample the slightly more expensive 10 and 20 year tawny ports, keeping in mind the names of Taylor, Dow and Fonseca. As soon as we see another VWSI of -10, I will elaborate on port in considerably more detail. This who catch the port bug are encouraged to take a peek at For the Love of Port to help further your interest.

Friday, July 27, 2007

VIX Soaring in 4:00 - 4:15 Window

For those who may not be aware of it, the VIX trades from 9:30 to 4:15 ET, with that additional 15 minutes following the close of regular trading on the equity exchanges often providing some insight into the think of traders going into the next session.

Well, at 4:00 ET the VIX was trading at 22.97, but it has jumped to 24.17 – another 52 week high – in the quarter hour since the final bell at the NYSE. My guess is that many had been playing for a bump rather than a plunge in the last half hour and are rethinking and/or hedging their positions going into the weekend during this 15 minute 'last call' window.

The Return of the Absolute VIX

When I started this blog, back in January of this year, it was widely accepted that volatility had died, crushed by the weight of an ocean of global liquidity. At the time, the VIX numbers had lost most of the meaning they once held. Always a resilient bunch, traders tried to compensate for the low volatility readings, first by declaring that 12 was the new 15, then 10 was the new 12, and finally capitulating by insisting that the VIX had outlived its usefulness. In a nutshell, that is how we made it to February 27th awash in complacency.

Bloggers were all over the story of the dead VIX. Ron Sen at Technically Speaking noted the prevailing sentiment about a terminally ill VIX as far back as November 2005. Even after the February 27th VIX melt up, MissTrade declared that the VIX corpse was “still dead.”

Fast forward to the present and here we are with a VIX in the 20s and suddenly the old numbers may have some meaning. Now 15 looks like the new 10 and it makes sense to talk about the absolute levels of the VIX, not just the VIX numbers relative to some moving average of recent values. Not only that, but it is time to consider mean reversion in the context of a VIX with a lifetime mean of 18.94. In looking at the chart below, one of the first things you notice is that whenever the VIX lives below its lifetime mean (the dotted blue line), the SPX is in a bullish phase, but when the VIX rises above the lifetime mean, the odds of a SPX bull drop back to no more than 50-50.

I will have a lot more to say about the absolute level of the VIX in the future. For now, I mostly want to stretch the historical context of the VIX back to encompass the full 17 ½ years of VIX data.


Thursday, July 26, 2007

Some Data on Post-Spike Performance

Back on February 27th, I posted about what typically happens following a 20% and 30% VIX spike. At a high of 23.37, the VIX was recently up 29.1% from the previous day.

You can follow the links below to get some historical context:


For what it's worth, I think today has been way overdone, but that doesn't necessarily mean the worst is over. I suspect it may take several weeks to get this one out of our system.

VIX 21.50 = Blood in the Streets

In panic there is always the greatest opportunity.

I am long equities and short the VIX, as we are at VWSI -10.

Today's VWSI of -10 Threshold is at 21.25

It the VIX jumps up to that level, it might signal a capitulation of sorts.

For what it's worth, I am starting to get short the VIX as it sits just below 21.

One Approach for Volatile Sideways Markets

About two months ago, I talked about three different buy-write products (two closed-end funds and an exchange-traded note or ETN) which are designed to mimic a strategy of writing covered calls, such as is tracked by the CBOE S&P 500 Buy-Write Index (BXM.)

I was being a little cheeky when I suggested that this index might be useful as a market timing tool. Instead, I figured that the best application of a buy-write strategy would likely be as a cash equivalent of sorts, particularly for those who were looking for a place to park their money somewhere that it could earn a reasonable return in a volatile sideways market, yet participate in any unexpected upward moves.

I think we may be in just that market environment right now.

If you are worried about the RUT falling through its 200 day SMA today and most of the other major indices penetrating their 50 day SMAs, then perhaps you should take a long look at the BEP, MCN and BWV. I am slightly partial to the BWV, because, as an ETN, it will not have (taxable) distributions. There has been very little volume in BWV in the two months it has traded, but with a typical bid-ask spread of 0.10, it is competitive with the more liquid BEP and MCN at least on a small scale.

Wednesday, July 25, 2007

VIX at 19.46

Time to buy equities...

Tuesday, July 24, 2007

VIX Has More Room to Run

Thanks in part to a strong earnings report from Amazon (AMZN), the VIX dropped back to 18.55 by the time of its 4:15 ET close, down from an intra-day high of 19.09.

How high will the VIX go from here?

Turning to the VWSI, I note that it closed at -3 today, indicating that there is still a fair amount of room for the VIX to run without getting overextended. For the VWSI to reach -6 tomorrow – the point at which I generally look to fade the move with options – the VIX will have to touch 19.26. Also consider that a VWSI of -8 requires that the VIX hit 19.46 tomorrow; the maximum reading of a VWSI of -10 would result from a VIX of 21.21. So, if it turns out that today’s 19.09 is not a near-term high in the VIX, I would expect to see the VIX topping out in the 19.50 – 21.50 range. (Note that all VWSI numbers are reset at the end of each day, so these thresholds are moving targets and will be lifted higher by a gradually trending VIX.)

One way to illustrate the moving target aspect of the VMSI is to look at the VIX’s somewhat analogous moving average envelopes. Shown below are the 10% (dotted green line) and 20% (dotted purple line) moving average envelopes that surround the VIX’s 10 SMA (solid blue line.) As the VIX has trended upward over the past three months, the moving average envelopes have risen with it, so while the 17.08 and 18.98 VIX spikes in early and late June look like breakouts that are highly susceptible to the gravitational pull of mean reversion, today’s runup to 19.09 looks much more like normal oscillation around an uptrending mean.

Of course the VIX should not be the only tool in your toolbox. When I look at put to call ratios, new highs and new lows, as well as other market sentiment data, the case for the VIX topping out soon looks fairly strong to me.

Earnings Spike Potential Algorithm v1.1

First there was the VWSI, now it seems like I am going to try to get ESPA (Earnings Spike Potential Algorithm) off the ground. This immediately raises the question: just how many ugly acronyms should I try to prop up in this space? Maybe I should just do it the way the rest of the world does and start with the acronym I want, then reverse engineer the full text.

Never one to leave well enough alone, I have taken my CNBC Million Dollar Portfolio Challenge (remember that disaster?) cardboard and duct tape version of the ESPA and tweaked it a little for the current earnings season. The changes are not that major and consist largely of beefing up some TA inputs having to do with support and resistance. The resulting ESPA v1.1 seems to do a better job of predicting the magnitude of the post-earnings move and a noticeably better job of picking the direction of that move (which was previously just a little above 50%.)

Armed with a better mousetrap, I will be more active in earnings plays this quarter than usual, using the model to be both long and short straddles and strangles, as well as playing some instances where I have directional bias with straight calls/puts or call/put backspreads.

I do not intend to clutter up with space with a flood of predictions or comments on individual stocks, though I may highlight one or two from time to time. Still, looking at some of the earnings spiker candidates for AMC today through BMO tomorrow, I was struck by the sheer number of stocks with a very high short squeeze potential and a high implied volatility, two ingredients that can help turn a couple of sparks into a widespread conflagration.

Stepping back a little, my thinking is that most of the recent market action has been of the healthy correction variety – the controlled burn that renews instead of destroys. I also think that much of the bearish sentiment we find rolled into an 18ish VIX is of the bullish contrarian variety. As far as I can tell, the big fears are on the table and in the headlines. I suspect that it will require something new and unanticipated to give us the type of conflagration where we could see something like the VIX of 25-30 referenced by Jim Kingsland.

DISCLAIMER: "VIX®" is a trademark of Chicago Board Options Exchange, Incorporated. Chicago Board Options Exchange, Incorporated is not affiliated with this website or this website's owner's or operators. CBOE assumes no responsibility for the accuracy or completeness or any other aspect of any content posted on this website by its operator or any third party. All content on this site is provided for informational and entertainment purposes only and is not intended as advice to buy or sell any securities. Stocks are difficult to trade; options are even harder. When it comes to VIX derivatives, don't fall into the trap of thinking that just because you can ride a horse, you can ride an alligator. Please do your own homework and accept full responsibility for any investment decisions you make. No content on this site can be used for commercial purposes without the prior written permission of the author. Copyright © 2007-2023 Bill Luby. All rights reserved.
 
Web Analytics