Showing posts with label devil's bottom. Show all posts

Thursday, April 30, 2009

Selling VIX Puts with the Help of a Put Matrix

The VIX was at 51.65 when the SPX formed its “devil’s bottom” at 666.79 almost two months ago. Since then, the SPX has gone up almost exactly one third and the VIX has dropped almost exactly one third. As the SPX continues to rise – recently breaking through an important resistance level at 875 – the VIX seems somewhat reluctant to continue lower. This is consistent with my statement of two weeks ago that “my personal forecast is for the recent decline in volatility to drop to no lower than the 30-32 level before flattening out.”

A floor in volatility does not necessarily mean that the VIX is destined to spike back up toward 50. It does, however, mean that some interesting VIX options trade may present themselves. For instance, if you believe that the VIX is not likely to stay below 35, you can sell a VIX put and capture a fair amount of premium with little downside risk. While ‘little’ is a subjective term, VIX puts are less risky than other naked puts because while volatility has a tendency to spike up, the path down (except from upward spikes) is almost always a gradual one.

With this in mind, I want to highlight an options matrix feature that optionsXpress has on their site. Customers can create either a call or put matrix for any optionable security and view the bid and ask prices over the next six months in a matrix format. The graphic below shows VIX puts from May to October at all strikes from 10 to 100.

If you study the chart, you can see a great deal of interesting information. Regarding the possibility of a VIX put floor, you can see it priced in. VIX May 35 puts can be sold for 1.90 at the moment, while the June 35s fetch 2.75. Going out further in time, however, yields very little in the way of incremental premium. The July 35s are bid at 3.10, the August 35s at 3.30, the September 35s at 3.40, etc.

For some additional fun, check out the bids for the 60 puts. They are almost identical for each month from May through October. Why? Part of the answer is that mean reversion is built into the options prices.

VIX options have some interesting quirks that take awhile for most investors to internalize. By looking at a put matrix or call matrix, however, it is much easier to get a sense of what types of future VIX moves are built into VIX options prices.
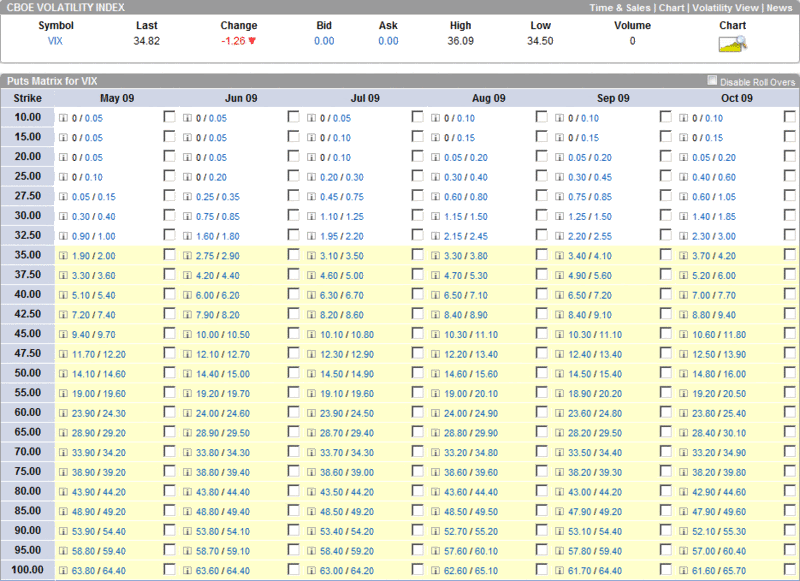
[source: optionsXpress]

Disclosure: Long VIX at time of writing.
Wednesday, April 8, 2009

Waiting for the Next Shoe to Drop?

There has been a lot of speculation about which corner of the economy is likely to implode next and start to write the next chapter in the current financial crisis. Credit card debt and commercial real estate are two of the most frequently cited potential culprits, but lately Eastern European banks have been under great stress, while credit default swaps for Romania, Bulgaria and Hungary have been on the rise.

I did not realize how strong the undercurrent of fear was until I ran Today’s Jump in the VIX on Monday evening. From the various public and private comments, it is clear that there is a strong contingent of veteran investors who anticipate not only that the next shoe will drop soon, but that the fallout will be at least as bad as what we experienced during the October-November peak of the crisis.

While I am not ruling out anything at this stage, I do not see the VIX spiking above 60 in the near future, nor do I even see a VIX above 50 as a likely scenario.

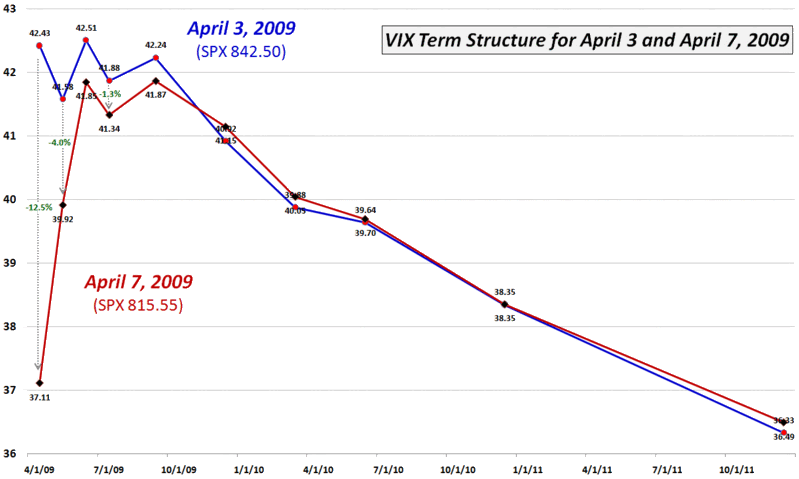
Last Friday, the SPX had its highest close since the 666.79 “devil’s bottom” low of March 6th. From Friday’s 842.50 close to Tuesday’s close of 815.55, the SPX fell 3.2%. During this same period, the cash VIX gained just 1.7%, moving up from 39.70 to 40.39. In the chart below, however, one can see that even thought the cash VIX rose, the volatility index for SPX options in April, May, June, July and September actually fell, with volatility for the April expiration showing a 12.5% drop in the VIX, May volatility dropping 4% and the June through September strikes show a volatility decrease on the order of 0.9%-1.6%. In other words, expectations for volatility – and presumably fear and uncertainty – for the balance of the year continue to point to improvement.

Of course, there is always a group of traders who get fearful when the VIX fails to measure what they believe is an appropriate level of fear. This group, whose concern I can sympathize with from time to time, will undoubtedly see an indifferent VIX as a reason to be even more concerned about the future.

For now at least, the VIX term structure points to increasing investor confidence in the markets and a decreasing concern about the possibility of gravity commingling ominously with oversized footwear.

[source: CBOE, VIXandMore]

Monday, April 6, 2009

Today’s Jump in the VIX

Lately it seems like I am the only one who is not talking about the VIX. I find it particularly ironic that many of the same people who were pounding the table saying that the market could not bottom unless there was another dramatic VIX spike and high volume capitulation are now insisting that the markets cannot rally from current levels until the VIX continues down. I suspect these pundits will end up going 0 for 2 in their predictions.

For the record, at the very moment the SPX formed the “devil’s bottom” of 666.79 on March 6th, the VIX was at 51.65, which was not even the high for the particular day. By the end of the day, the VIX was down to 49.33 in what looks in retrospect like a classic stealth bottom.

So what is driving the VIX right now? In a previous post, I opined that a simplistic conceptual model of the VIX is one which “incorporates incremental changes in uncertainty and fear on top of recent historical volatility.” Many of the common measures of historical volatility (10, 20, 30 and 50 day) show that historical volatility in the SPX topped in the middle to latter portion of March. Since the 7.08% jump in the SPX on March 23rd, trading has been relatively subdued from a volatility perspective. As that 7.08% jump as well as the 6.37% and 4.07% jumps from March 10th and March 12th begin to scroll off the lookback window, historical volatility numbers should begin to lead the VIX back down.

As far as fear and uncertainty are concerned, the fear of a global systemic bank failure seems to be receding, while concerns about a deepening global recession are lingering and still rising in some quarters. The G-20 meeting underscored the willingness of leaders of the world’s largest economies to coordinate their activities, even if they cannot agree on the details of those coordinated efforts.

Finally, we are in a news cycle lull this week, but earnings season officially kicks off with Alcoa (AA) reporting tomorrow.

The bottom line is that current levels of the VIX are in line with historical volatility readings and changes in the macroeconomic landscape. The fear component of the VIX is clearly on the wane, which should mute any VIX spikes. On the other hand, historical volatility needs to continue to decline and the VIX term structure (which is based on SPX options) and VIX futures need to soften somewhat before the VIX can reasonably be expected to start trading in the 30s on a regular basis.

Many analysts have a tendency to rely too heavily on charts when looking at the future of the VIX. While charts can provide some useful information and it is nice to know that the VIX has recently moved below its 200 day moving average, sometimes putting the VIX in the proper geopolitical and macroeconomic context is a more valuable approach.

So…I think the VIX is about where it should be right now and stocks can resume their move up without the VIX being required to plummet. In fact, if the bulls continue to keep the upper hand, expect the VIX to decline in a decidedly gradual fashion.

Finally, the VIX jumped 3.1% today, while the SPX lost 0.83%. That -4x move is typical of the VIX, but not on Mondays, when ‘calendar reversion’ usually means the VIX jumps about 1.5%. Add to this the 1.53% that the VIX fell during the 4:00 – 4:15 p.m. ET index trading portion of Friday’s session and one could make the argument that the VIX barely moved at all today relative to the SPX.

For another perspective on the recent movements of the VIX, I recommend More Ways to Look at Volatility from Daily Options Report.

DISCLAIMER: "VIX®" is a trademark of Chicago Board Options Exchange, Incorporated. Chicago Board Options Exchange, Incorporated is not affiliated with this website or this website's owner's or operators. CBOE assumes no responsibility for the accuracy or completeness or any other aspect of any content posted on this website by its operator or any third party. All content on this site is provided for informational and entertainment purposes only and is not intended as advice to buy or sell any securities. Stocks are difficult to trade; options are even harder. When it comes to VIX derivatives, don't fall into the trap of thinking that just because you can ride a horse, you can ride an alligator. Please do your own homework and accept full responsibility for any investment decisions you make. No content on this site can be used for commercial purposes without the prior written permission of the author. Copyright © 2007-2023 Bill Luby. All rights reserved.
 
Web Analytics