Showing posts with label VXTYN. Show all posts

Friday, August 9, 2013

Fox Business TV Appearance on Gerri Willis Show

Last month I wrote a guest column for The Striking Price on behalf of Steven Sears at Barron’s, entitled: How to Spot Risk Early. That column has received a fair amount attention and yesterday it landed me on Fox Business with Gerri Willis of The Willis Report in a segment with the title, How to Foresee Trouble in the Markets.

I should point out that this was the first time I have done an interview via a remote studio link and the experience was a little unsettling, sitting in a dark room staring off into the blackness while being assaulted by two huge spotlights that seemed as if they could illuminate an entire baseball field for a night game. Without the benefit of a monitor of having any idea what the feed looked like, I found myself talking to a voice inside my head staring into the darkness with absolutely zero idea what the feed might look like on TV. Fortunately the result was not as bad as I had feared.

Related posts:

A full list of my Barron’s contributions:

Disclosure(s): none

Tuesday, July 16, 2013

Guest Columnist at The Striking Price for Barron’s: How to Spot Risk Early

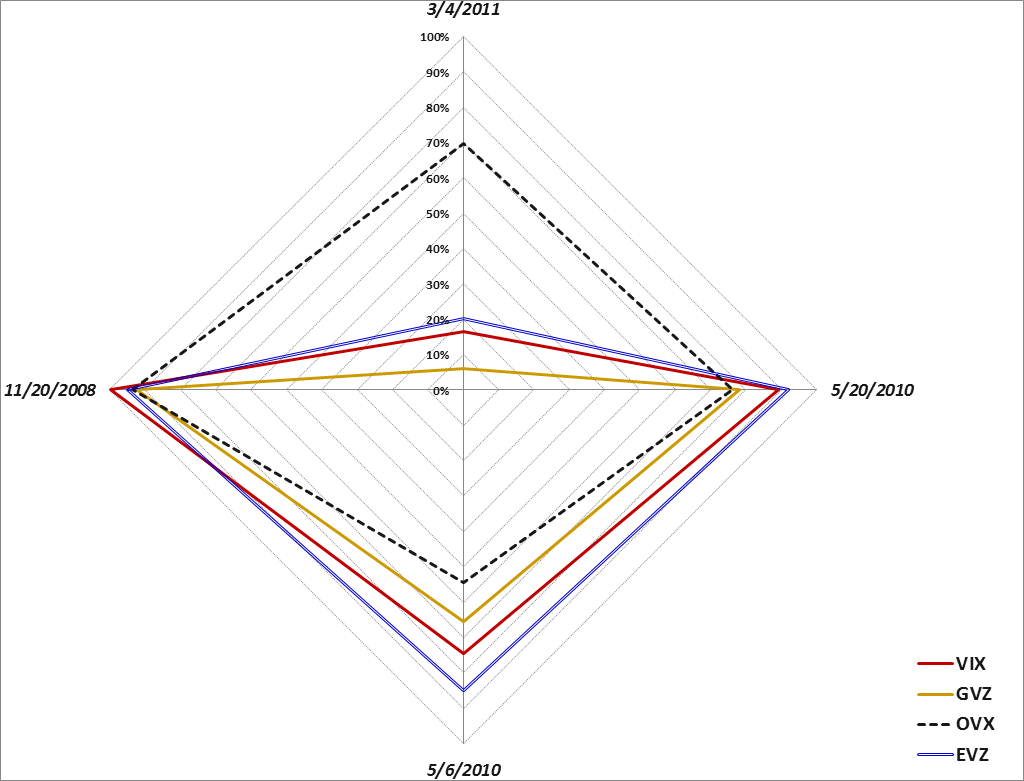
Today’s guest column, How to Spot Risk Early, at The Striking Price on behalf of Steven Sears at Barron’s, is the eleventh time I have had the opportunity to write a column for Barron’s. Today’s column picks up on a theme I addressed in a March 2011 article in Expiring Monthly which was titled, Evaluating Volatility Across Asset Classes. In that 2011 article, I introduce the concept of a volatility compass as a framework for evaluating the different types of volatility spikes that were seen in the 2008 financial crisis, the euro zone crisis as of May 2010, the Arab Spring in March 2011, and the May 6, 2010 flash crash.

[Volatility compass showing different levels of volatility across asset classes during four recent spikes in volatility. Source(s):VIX and More]

In the 2011 article I provide an overview of my thinking as follows:

“It is my belief that a better understanding of the volatility picture across asset classes will yield a better grasp of volatility events and help to identify a number of favorable trading setups.”

Later on I conclude the article with the following thoughts:

“For those who have studied sector rotation strategies and methods for trading geography-based ETFs, some of the analytical techniques used in those two disciplines can be carried over to an analysis of cross asset class volatility.

Ultimately, the study of volatility has both a science and art component to it, but a cross asset class approach provides a more broad-based holistic view of the volatility landscape and adds a little more science to the mix.

At some point, volatility becomes the study largely of contagion and falling dominoes. I can say without hesitation that a multi-disciplinary approach is essential to understanding contagion and dominoes and that a cross asset class analytical framework supplemented by tools such as the volatility compass is an effective way to approach that subject.”

In today’s Barron’s article, I expand upon the idea of four types of volatility indices and address volatility indices that provide a snapshot of geographical uncertainty and risk as well as broader measures of uncertainty and risk across asset classes such as U.S. Treasury Notes and currencies.

I will have more on this subject in the future, but for those interested in researching some of these subjects, I have highlighted some previous posts on different ways of thinking about uncertainty, risk and volatility below.

Related posts:

A full list of my Barron’s contributions:

Disclosure(s): none

Tuesday, June 25, 2013

VXTYN Measures Volatility in U.S. Treasuries and Potential Spillover Effect

Recently I have been highlighting some non-traditional measures of volatility and risk in the financial markets, including VXEEM (CBOE Emerging Markets ETF Volatility Index); DXJ (WisdomTree Japan Hedged Equity Fund); and DBV (PowerShares DB G10 Currency Harvest Fund). Part of my intent in focusing some attention on these largely under-the-radar indices and ETPs is to get more investors to think about risk more broadly across geographies and asset classes.

One asset class that should absolutely be watched closely by even those stubbornly equity-centric investors (and I know you are out there in larger numbers than you care to admit) is U.S. Treasuries. Of course U.S. Treasuries come in quite a few flavors, but the most important is probably the U.S. 10-Year Treasury Note. In a display of impeccable timing, last month the CBOE and the CFE teamed up to launch a new volatility index based on this security: CBOE/CBOT 10-year U.S. Treasury Note Volatility Index (VXTYN).

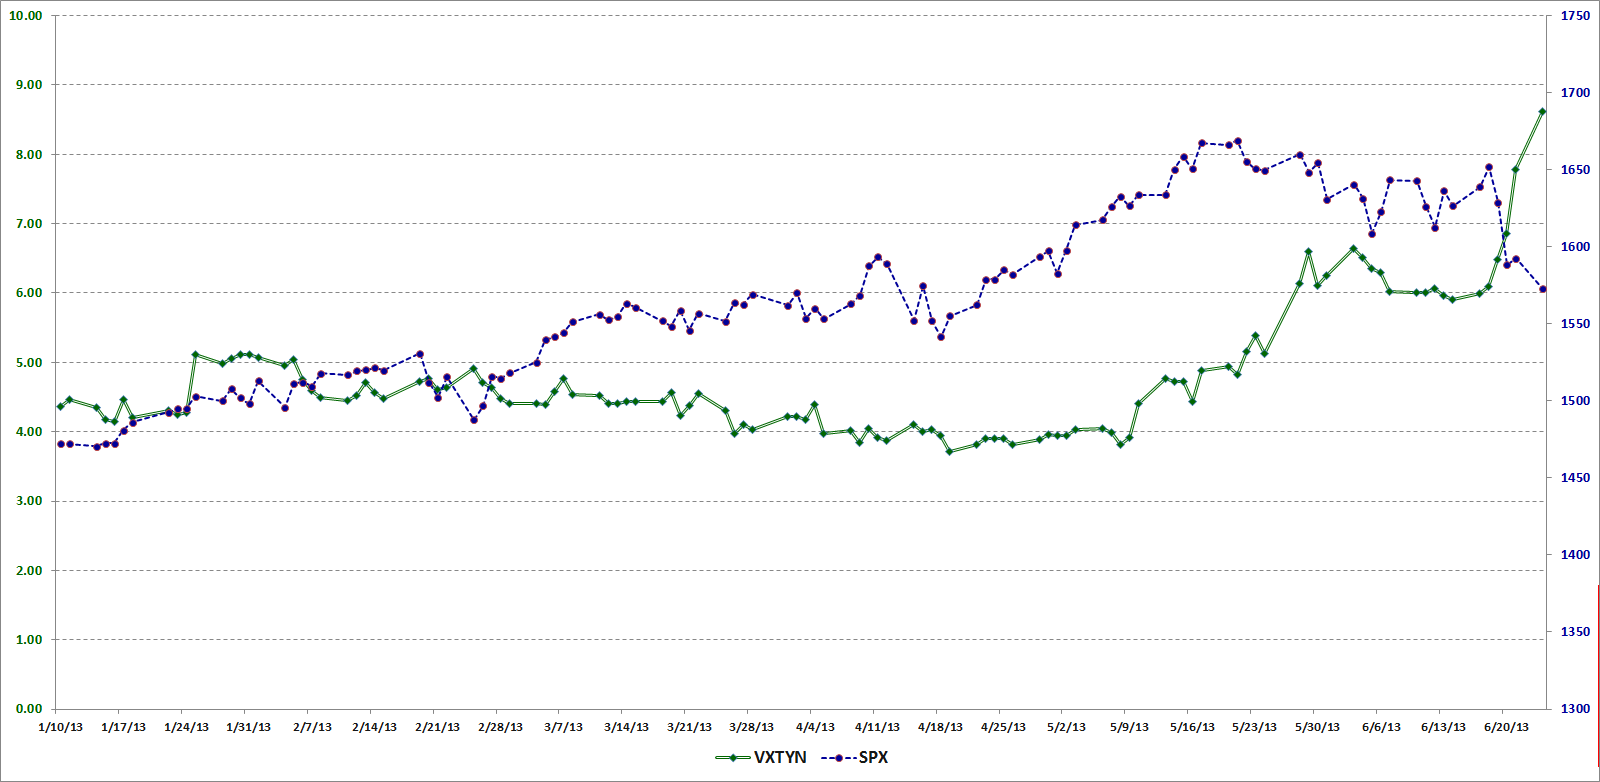
In the chart below, I show the path of VXTYN and the SPX going back to January 10, 2013, which is the beginning of the historical data for VXTYN provided by the CBOE. Note that VXTYN only began rising in May and when hit has made a substantial move up, that has preceded a decline in stocks.

[source(s): CBOE, Yahoo, VIX and More]

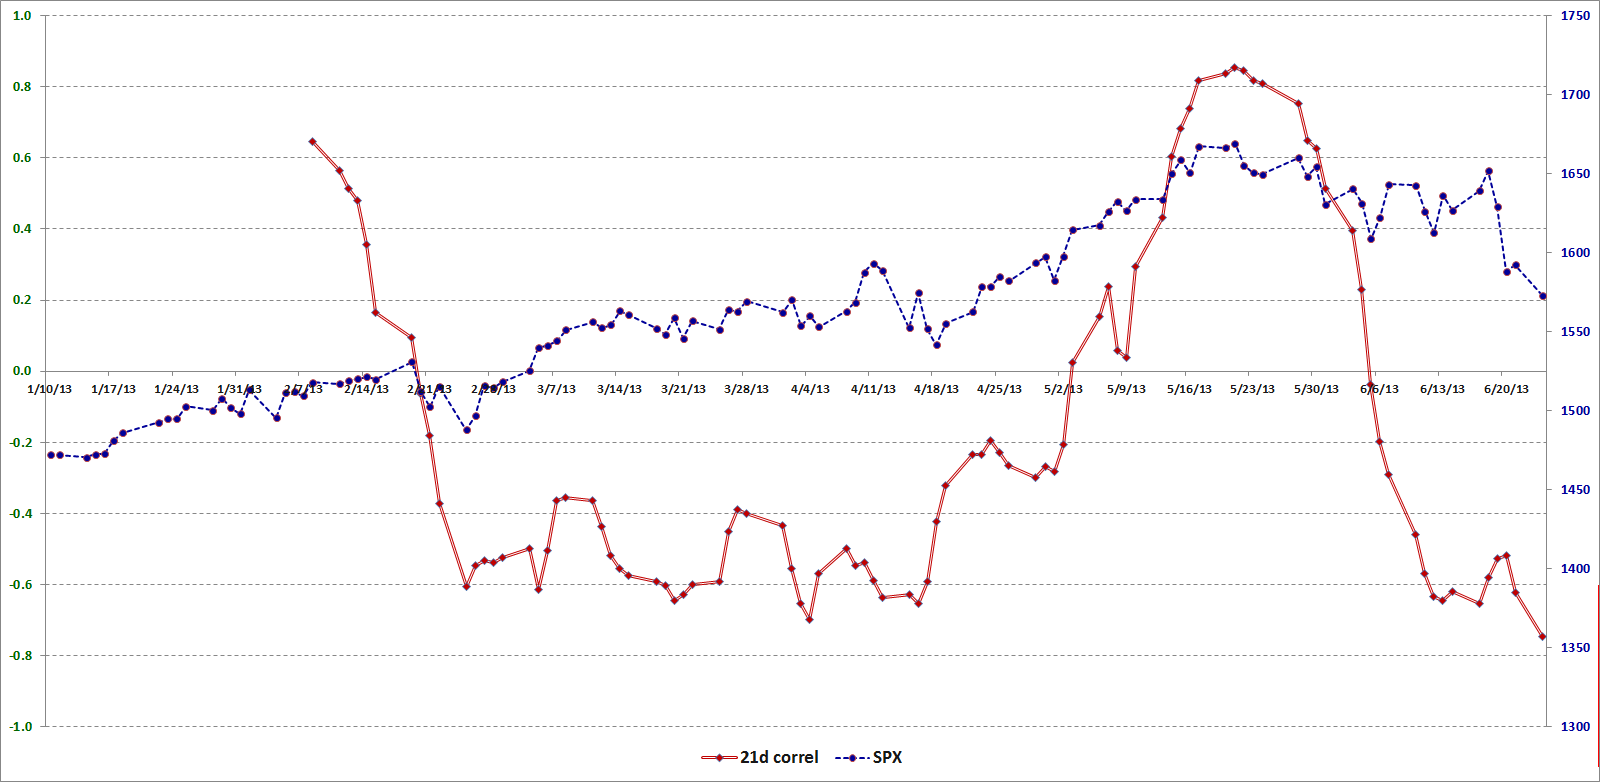
Just for fun, I am also including a chart that shows a 21-day rolling average of the correlation between VXTYN and the SPX. Here the relationship between the swings in correlation and subsequent moves in stocks may be easier to visualize. With less than months of historical data to draw on, I would caution against jumping to conclusions regarding correlation and causation, but at the very least I thought this graphic might provide some food for thought.

[source(s): CBOE, Yahoo, VIX and More]

Last but not least: did you know there are ETPs for placing bets on whether the Treasury yield curve will get steeper or flatter? I highlighted these products back in 2010 in Treasury Yield Curve ETNs and Volatility; they are known formally as the iPath US Treasury Steepener ETN (STPP) and the iPath US Treasury Flattener ETN (FLAT).

Related posts:

Disclosure(s): long DXJ at time of writing; the CBOE is an advertiser on VIX and More

DISCLAIMER: "VIX®" is a trademark of Chicago Board Options Exchange, Incorporated. Chicago Board Options Exchange, Incorporated is not affiliated with this website or this website's owner's or operators. CBOE assumes no responsibility for the accuracy or completeness or any other aspect of any content posted on this website by its operator or any third party. All content on this site is provided for informational and entertainment purposes only and is not intended as advice to buy or sell any securities. Stocks are difficult to trade; options are even harder. When it comes to VIX derivatives, don't fall into the trap of thinking that just because you can ride a horse, you can ride an alligator. Please do your own homework and accept full responsibility for any investment decisions you make. No content on this site can be used for commercial purposes without the prior written permission of the author. Copyright © 2007-2023 Bill Luby. All rights reserved.
 
Web Analytics