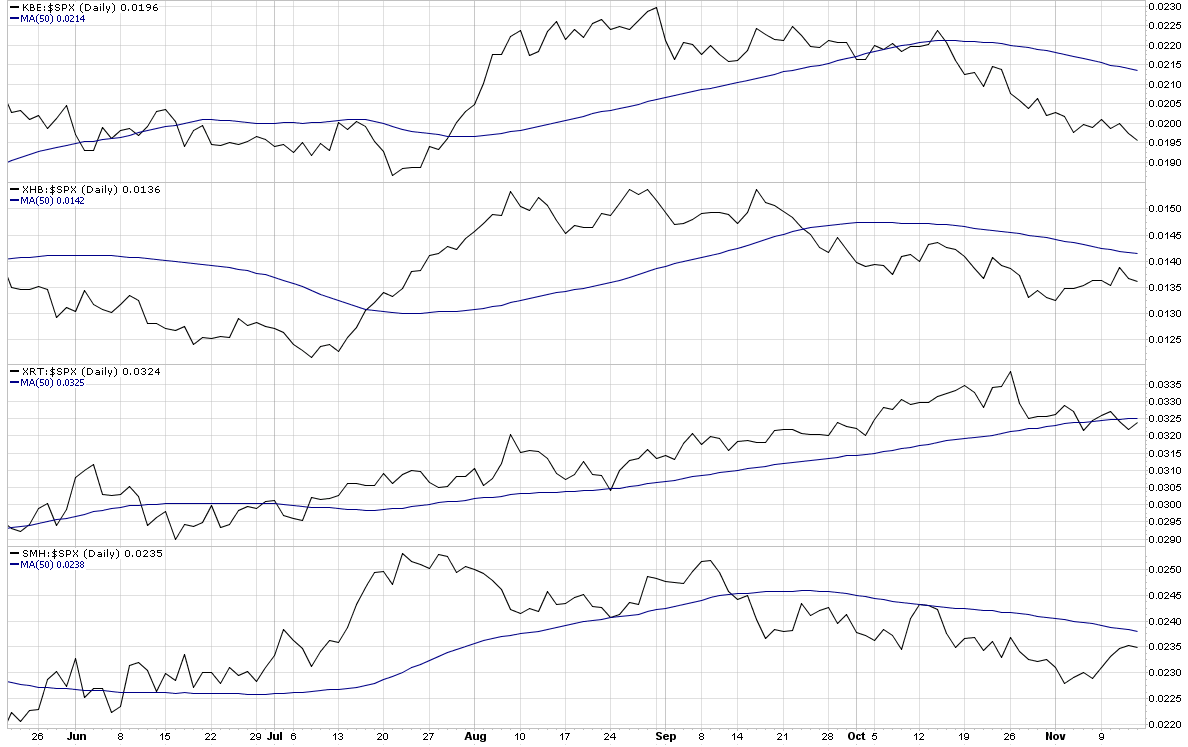
Chart of the Week: Four Key Sectors Struggle
While I still have at least one and a half feet placed firmly in the bull camp, I am increasingly concerned with a number of signs from some key technical indicators. Near the top of my list of concerns is market breadth, as measured by the McClellan Summation Index and other similar market breadth indicators. The bottom line is that if the indices continue to advance on the strength of a narrow base of rising stocks while the majority of issues move sideways or decline, then the rally will have trouble sustaining itself.
During the last few weeks, several key sectors have been underperforming the S&P 500 index, notably banks (KBE); homebuilders (XHB); retailers (XRT); and semiconductors (SMH). This week’s chart of the week shows the performance of the four sectors relative to the S&P 500 index over the course of the last six months. In all four instances, these critical sectors are below the 50 day average of their ratio to the SPX and in the case of the banks, the relative performance gap is increasing almost on a daily basis.
Going forward, I would expect that the major market indices such as the SPX will have difficulty making new highs if all four of these sectors continue to underperform on a relative basis. For this reason, I will keep an eye generally on market breadth and specifically on these four key sectors.
For additional posts on related subjects, readers are encouraged to check out:
- Chart of the Week: Lack of Volume and Breadth Threatens Bull Move
- Three Pivotal Sectors: Financials; Homebuilders; and Consumer Discretionary
- Two Thoughts on the McClellan Summation Index
- The McClellan Summation Index

[source: StockCharts]

