Showing posts with label NYHGH. Show all posts

Monday, April 2, 2007

Did We Dive Deep Enough?

After five weeks of increased volatility and a pullback in the S&P 500 that topped out at 6.7%, the question everyone is asking is whether the 6.7% drop was enough to wring out the excesses of the bull market and provide a wall of worry for further advances…or whether a nastier bear ambush lies just around the corner.

In a Sentiment Primer (Long), I did not spell out which scenario the sentiment indicators are pointing to, but if you read my comments on the ISEE the previous day, you know that the case for a resumption of the bull market is strong.

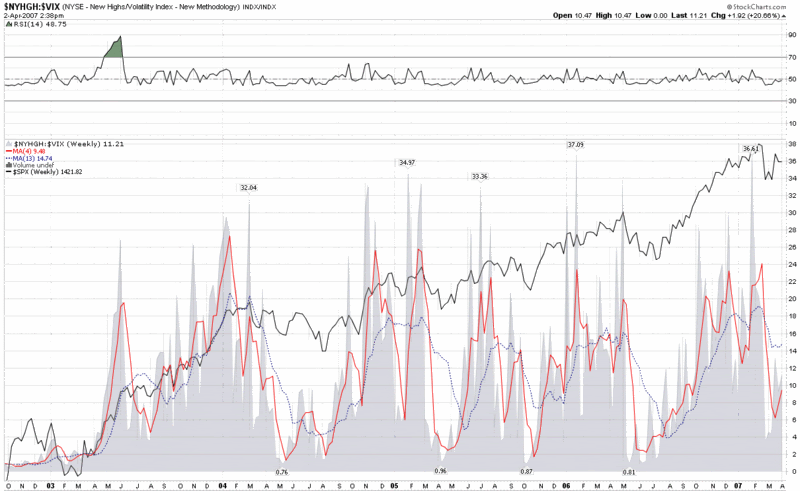
One group of indicators that I purposely left out of my sentiment primer is variously know as market internals, momentum, strength, etc. These include market breadth (advance-decline lines) data, the number of new highs and lows, and the percentage of a group of stocks trading above certain moving averages, among others. I will talk about these indicators in more detail in a future post, but for today I merely wish to update a chart I first posted and discussed here two weeks ago: a ratio chart of the new highs in the NYSE to the VIX.

The current version of the chart, appended below, shows the full extent of the effect on the ratio during the market pullback, in which a small “W” formed in the SPX. By the standards of the past four years, the drop in the ratio was relatively mild compared to other drops, including the May-July 2006 correction. This is partly due to the dramatic spike in the VIX, as we have discussed here ad nauseum, but also a function of the persistence of new highs in the NYSE, as recently noted by Headline Charts.

For the last three years, the 52 week average (not plotted) for the NYSE new high to VIX ratio has held steady in the 10-14 range. As current readings approach this range, the likelihood of the markets running into another bear ambush and bout of echo volatility is slowly receding.

(click to enlarge)

Friday, March 9, 2007

Canary or Canard?

Earlier in the week, I introduced a ratio chart of the percentage of S&P500 stocks above their 50 day SMA divided by the VIX. I described this as an attempt to find a rough approximation of greed ÷ fear. Since this chart received some favorable reviews, let me unveil another VIX ratio chart that attempts identify the same market sentiment extremes and provide a warning about the increased probability of near-term market highs and lows.

The chart below is a weekly chart of the ratio of the new 52 week highs in the NYSE divided by the VIX. I focus primarily on the raw number and the 4 week SMA. You can see from the chart that raw reading above 30 and a 4 week SMA readings above 20 tend to signal that a top is near.

In fact, this chart provided excellent advance notice of the 2/27/07 top, the 5/11/06 top, and previous tops in March 2004 and March 2005. With bottoms, the record is not quite as good, with an excellent advance call of the October 2005 low, but calls that were too early for May-July 2006, March-August 2004, and July 2002-March 2003.

You can decide if this ratio chart deserves a spot in your toolbox or bird cage or whatever it is that you use to try to divine the future. For me, it’s a keeper.

DISCLAIMER: "VIX®" is a trademark of Chicago Board Options Exchange, Incorporated. Chicago Board Options Exchange, Incorporated is not affiliated with this website or this website's owner's or operators. CBOE assumes no responsibility for the accuracy or completeness or any other aspect of any content posted on this website by its operator or any third party. All content on this site is provided for informational and entertainment purposes only and is not intended as advice to buy or sell any securities. Stocks are difficult to trade; options are even harder. When it comes to VIX derivatives, don't fall into the trap of thinking that just because you can ride a horse, you can ride an alligator. Please do your own homework and accept full responsibility for any investment decisions you make. No content on this site can be used for commercial purposes without the prior written permission of the author. Copyright © 2007-2023 Bill Luby. All rights reserved.
 
Web Analytics