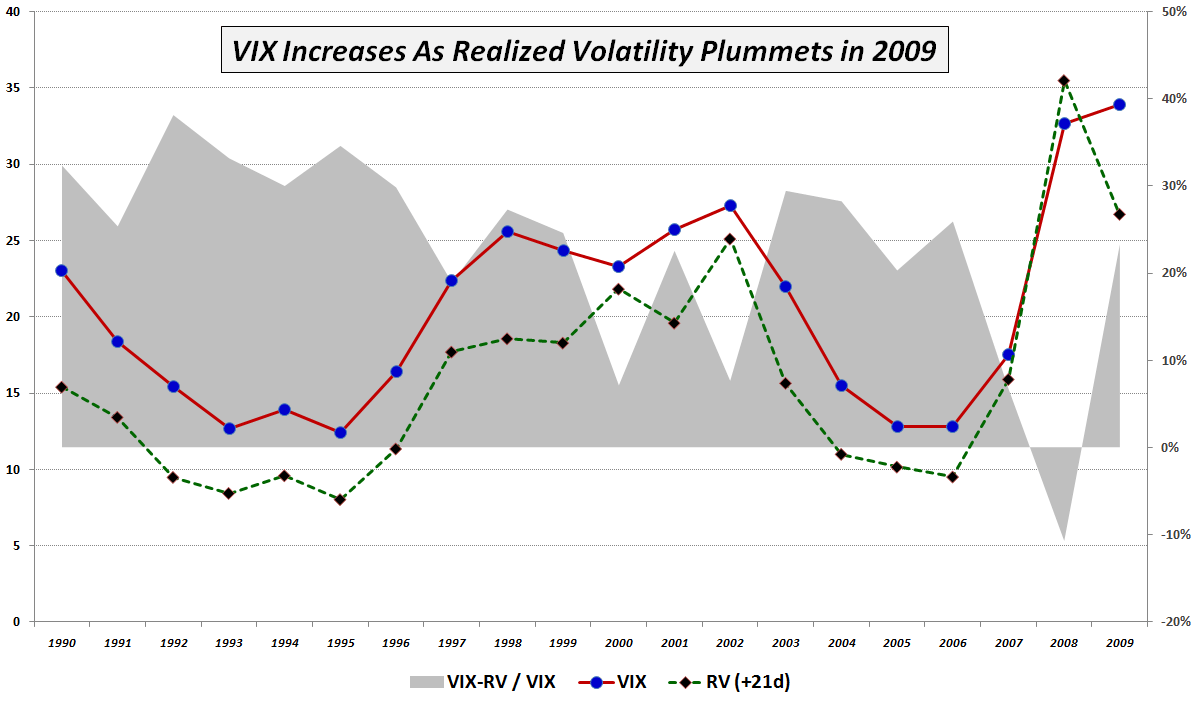
At the risk of beating to death last week’s theme of availability bias and disaster imprinting as part of the explanation for some of the “realized volatility gap, persistent VIX futures contango and off-center VIX:VXV ratio,” I thought it might be informative to present a simple piece of research which supports the idea that the 2009 volatility picture has been an extremely abnormal one.
In the 20 years of VIX historical data, the VIX has typically overestimated the realized volatility 21 trading days hence, which is reflected in the chart below by the dotted green RV (+21d) line. In fact, the gray area portion of the graphic, which represents the difference between the VIX and realized volatility 21 trading days later, was close to 30% in the first half of the 1990s; more recently it has been averaging closer to 20%. The VIX actually fell below realized volatility for 2008, which is not surprising, given the volatility extremes of October and November. What is particularly noteworthy about this chart, however, is that during 2009 the VIX is actually 3.8% higher than it was in 2008, which realized volatility has actually fallen 24.7%. It is almost as if the VIX refuses to believe that realized volatility is declining and insists that the gravitational forces of mean reversion be suspended until further notice. This is a large part of the reason why 2009 has been a boon to options sellers.
For additional posts in this series, which I have listed in reverse chronological order, readers are encouraged to check out:
- The VIX:VXV Ratio, Availability Bias and Disaster Imprinting
- Availability Bias and Disaster Imprinting
- The VIX Spike Conundrum
- Anchoring and VIX of 20
- The Gap Between the VIX and Realized Volatility
