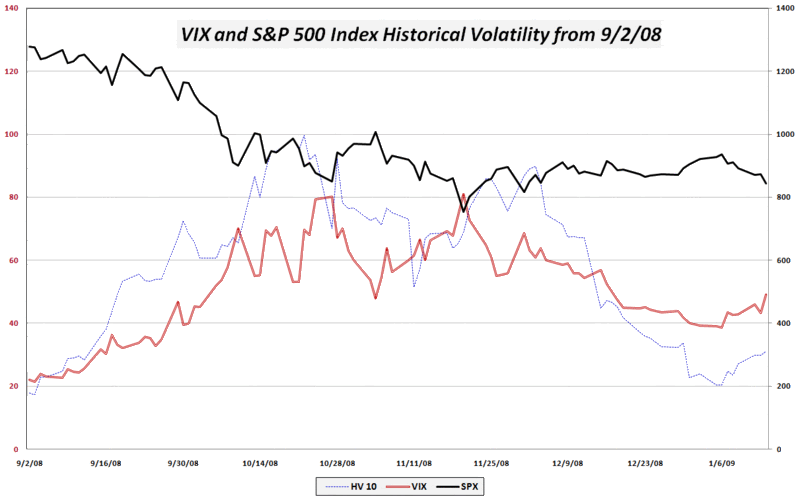
During my recent trilogy on the put-write strategy, my intent was to identify an approach that performs well in a non-trending market. While I still believe we are stuck in a range defined by about 820-980 on the S&P 500 index, a strategy that involves selling puts generally performs at maximum levels toward the bottom of a well-defined trading range. In short, the current situation looks like an excellent time to write some cash-secured puts.
Several factors indicate that the timing for put sales may be ideal right now. With the VIX up over 51 once again as the market opens this morning and most measures of short-term historical volatility (such as the 10 day HV in the chart below) showing that the VIX is well above actual volatility we have experienced during the past few weeks, a likely conclusion is that volatility is overpriced at current levels. Further, with the SPX right at 830 as I type this, we are near the bottom of the trading range in the SPX, with significant support likely to be found in the 820-830 range.
Finally, the news flow has been so negative lately, from financials to retailers to Steve Jobs to global trade, etc. that a larger fear and anxiety component is starting to creep into implied volatility measures like the VIX.
For those looking to limit risk, cash-secured puts on indices or ETFs covering a group of stocks can help to eliminate single stock down side risk. Those who are interested in limiting risk from writing puts may prefer to look at a bull put spread, where the writer sells a put near the money and buys another out of the money put to limit losses.

[source: VIX and More]
We may be on the low end of the trading range, but in this environment we could easily extend to a new low making those naked puts quite a bit more expensive than what you sold them for.
ReplyDeleteYou could well be correct, but to me this does not seem like an environment where you want to be putting on any lopsided risk/reward trades.
Of course this is just my opinion. By the way I do enjoy your blog immensely.
The 200 point band of resistance between DJIA 8827-9026 and between SPX 888.65-918.85 was not broken between Nov 11th and Dec 31st. These resistance levels were only temporarily and marginally broken in the first three trading days of 2009. The highest intraday level for the DJIA in 2009 and over the last forty-three trading days occurred on Jan 6th at 9088 and it closed within the 8827-9026 resistance area (at 9015) that day. The highest intraday level for the SPX also occurred on Jan 6th at 943.85 and it closed within the 888.65-918.85 resistance area one trading day later. The area between DJIA 8827-9026 and between SPX 888.65-918.85 has been a good area to short various markets and/or to sell call option credit spreads for over two months.
ReplyDeleteThis has always been a great strategy, and more so know, as along as you can hold on to your nickers.
ReplyDeleteIndeed this has been a good strategy. Ironically not much more "dangerous" than owning stock.
ReplyDeleteThere have been a few great opportunties in the past 2 months. C, DRYS, XLF, PGH, and bunches of others. Mammoth Volatility, offers a number of very good opportunities. I been more confident with index options than individual equities.