The Concrete Shoes of XLF
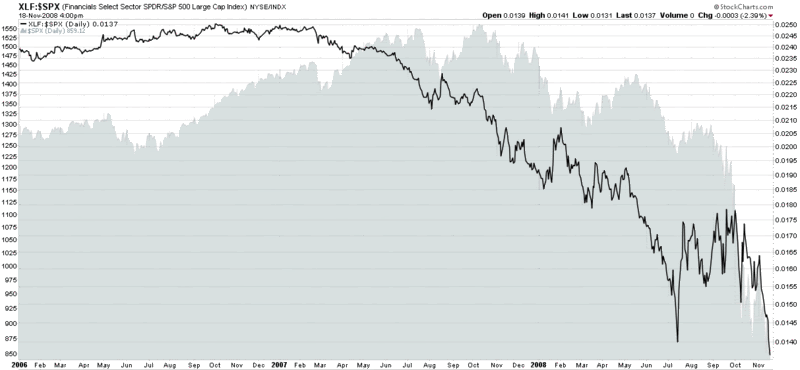
Lately there have been quite a few days when it looks as if the market is wearing ‘concrete shoes’ and will never be able to keep its head above water. Time and time again the financials look like those concrete shoes: financials plunge; the market follows.
In fact the performance of financials relative to the broader market has been weakening steadily since early October 2006, when the ratio of financials (XLF) to the S&P 500 index (SPX) peaked. The chart below tracks this ratio since the beginning of 2006 and shows how financials have pulled the broader market down. Additionally, the chart reveals that almost every temporary improvement in the ratio has been an excellent shorting opportunity.
The chart also demonstrates that temporary bottoms in the ratio have presented some tradeable though short-loved opportunities on the long side. This morning the XLF and the XLF:SPX ratio are once again making new lows. Eventually the ratio will find a bottom. If the patterns in this chart hold true to form, the bottom in the ratio will precede a bottom in the SPX.

[source: StockCharts]


2 comments:
Bill,
regarding the *cash* VIX, the 21-day S&P 500 historical volatility and the VIX front month future (since today VIX DEC'08), fear seems to have returned to the market.
Assumed the market would close at current data (13:43 p.m. ET), the 21-day S&P 500 historical volatility would be at 66.66% while the VIX is trading at 72.91. So the *cash* VIX did not only erase all it's negative premium we saw during the last 2 trading weeks, it would close with the 2nd highest positive premium versus the 21-day S&P 500 historical volatility since July 16, 2008.
The highest premium during the last 4 month occurred on October 10 (9.80%), and we got a more than 10% rally the next trading day (past performance is of course no guarantee for future performance).
Additionally last month the day the VIX OCT'08 futures settled and VIX NOV'08 futures became front month (October 22), this day VIX NOV'08 futures were closing with a huge negative premium of more the 21.10% versus the *cash* VIX (which was closing at 69.95, almost identical to the current *cash* VIX), while today VIX DEC'08 futures do only have a negative premium of approximately 10% (nobody seems to expect to see the *cash* VIX below 62 on December 17).
At least some cooperative data (concerning a positive market rebound) from the VIX (cash and futures) and S&P 500 historical volatility side.
Best regards
Frank
In yesterday's subscriber newsletter I noted "...the last two times the VIX closed higher than the 20 day historical volatility in the SPX, the next day the SPX had its two biggest one day gains in the last 20 years: an 11.6% gain on October 10 and a 10.8% gain on October 27."
Post a Comment