With the VIX spiking over 30 this morning and investors wondering if the markets will ever find a bottom, this seems like a good time to talk about VIX spikes and market bottoms. Specifically, I want to dispel the myth that bear markets have to end in some grand capitulation climax that includes a dramatic volatility spike.
A perfect counter example to the VIX spike requirement can be found in the bear market that followed the NASDAQ boom which crested in March 2000. In fact, with the exception of the current bear market, the 2000-2002 bear market is the only bear market since the launch of the VIX back in 1993 or the historical reconstruction of VIX data by the CBOE that dates back to 1990.
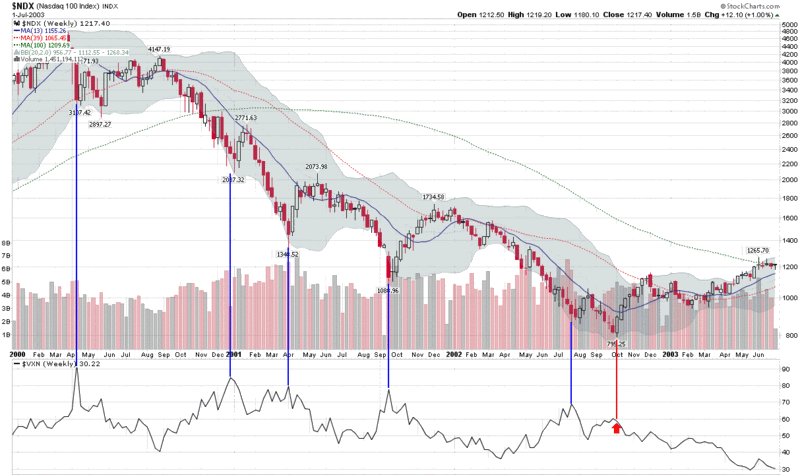
Rather than use the SPX and the VIX to demonstrate my point, the chart below uses the NASDAQ-100 index (NDX) and its companion volatility index, the VXN. The reason I chose the NDX is that from the March 24, 2000 peak (4816.35) to the October 8, 2002 bottom (795.25), the NDX lost an astonishing 83.5% of its value. If there was ever an opportunity to witness a dramatic drop and capitulation, this was the market and index in which to see it happen.
If one looks at a chart of the NDX and the VXN for the period 2000-2002, five distinct VXN spikes stand out. I have highlighted these with a blue vertical line for easy reference in the chart below. It turns out that those who went long at the time of these volatility spikes saw anywhere from two weeks of a bounce to several months of mostly sideways action. None of these spikes signaled a lasting market bottom.
When the NDX finally hit bottom (marked by the red vertical line and arrow), the VXN barely moved at all. Yes, the nastiest bear market of the last two decades ended with a volatility whimper. I like to call this type of bottoming action a "stealth bottom."
Capitulation comes in all shapes in sizes. Most bottoms are marked by a VIX spike. If, however, you assume that volatility spikes will mark the bottoms and bottoms cannot form without a VIX spike, you will be overlooking an important lesson from perhaps the most important recent bear market.

[source: StockCharts, VIX and More]
thanks for posting this, bill. exactly what I was looking for - vix over 30 and doesn't quite feel over yet... nice to hear an expert explain why!
ReplyDeleteThank you!
ReplyDeleteVIX's going for a much higher spike to make up for the lackluster spike in mid July.
ReplyDeleteJimmy
Bill,
ReplyDeleteHow significant is it that VIX broke & closed above the January, March, July downtrend line ? To me that suggests that short-to-intermediate term we will break stk mkt lows considerably.
Regards,
dave
Hi Dave,
ReplyDeleteNow that we have this morning's even larger VIX spike, the downtrend line has been pierced even more dramatically. I do think this is an important development, but I also think this means a higher likelihood of a ST to IT bottoming process.
Cheers,
-Bill
Does anyone know where to get real time quotes for the VIX?
ReplyDeleteIt is delayed on the CBOE website and through Yahoo Finance real time quotes service.
Thanks in advance.
you should ask your broker. most have real-time access to it. i have TD Ameritrade and the Command Center product have real-time access to various indexes.
ReplyDeletejimmy
HI
ReplyDeleteur words were really useful for my study. can any1 tell me as to from where i can find real time INDIAN VIX for INDIAN STOCK MKTS
plz provide me the information on my mail id pawan3182@gmail.com
thanks and regards