Showing posts with label SPX. Show all posts

Monday, February 5, 2007

The VIX and 3% SPX Rises

Last week I looked at what happens to the VIX leading up to and following a 3% drop in the SPX. Turning to the VIX in the five days before and after a 3% rise in the SPX, the composite visual of these 26 data points is much less compelling:
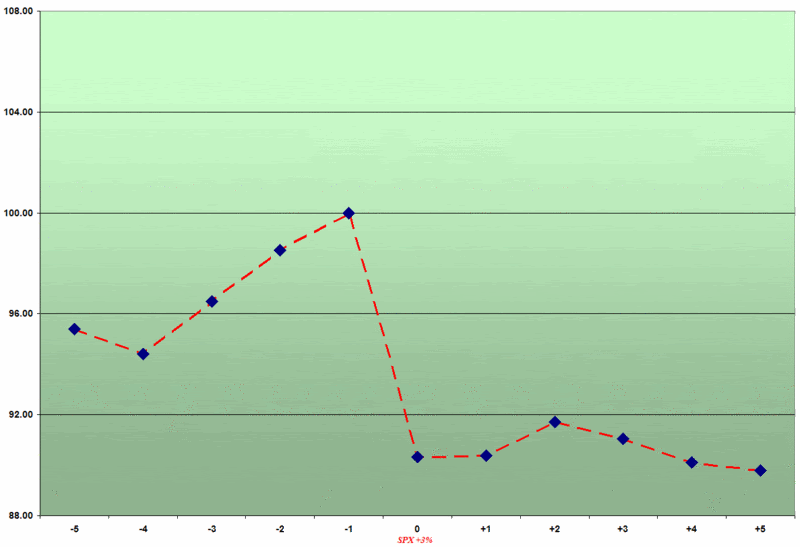

I previously noted that while the VIX surging an average of 10% in the four days prior to the SPX drop might have put some on notice that fireworks could be on the horizon, given the VIX's beta of -7 to -8, there were enough 'false alarm' 10% moves in four days to make this a weak predictive signal. Looking the VIX in the five days before and after a 3% rise in the SPX, any predictive value in a VIX move is much weaker, on the order of 5% on average during the three days prior to the 3% VIX jump.

Two other comparative points are worth noting here:

  • Whereas a 3% or more drop in the SPX spiked the VIX 14.3%, on average, a 3% rise in the VIX only moved the VIX down 9.7%, on average
  • While the VIX retraced 70% of its gains in the five days following the 3% SPX drop, when the SPX jumped 3%, the VIX was below the -9.7% drop and still moving lower four and five days after the SPX move

I will return to the asymmetrical mean reversion tendencies of VIX spikes in future posts here, but for now I will conclude by puting forth the following working hypothesis: the widely accepted belief that the VIX generally reverts to the mean is more valid for sharp VIX moves up than sharp VIX moves down.
Friday, February 2, 2007

The VIX and 3% SPX Drops

What happens to the VIX when the SPX drops 3% in one day? Does the VIX provide any advance warning of a selloff or merely serve as a contrary indicator after the fact?

Since 1990, there have been 25 instances in which the SPX has fallen 3% or more in one day. In analyzing those movements, it is important to remember that volatility has a strong tendency to cluster; as a result, a majority of the data points I looked at happened to fall within the same month and many were during the same week as another 3% drop. This should not be surprising, as almost all of the SPX plunges from the last decade have been triggered by the Asian financial crisis (including the spillover into Russia and Brazil) and the unwinding of the dot com bubble.

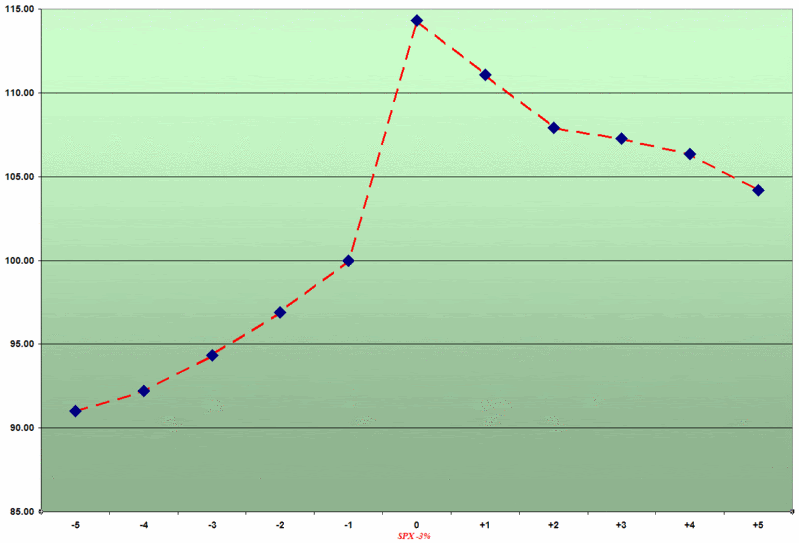
The following graphic depicts a composite view of changes in the closing price of the VIX on the 25 occasions from 1990 to the present in which the SPX has dropped 3%:


Note that the scales fixes the close on the day before the 3% drop at 100, so that percentage moves to and from that point are easier to calculate. It is worth highlighting that while the actual values of the VIX are not included here, only twice during this period did the SPX drop 3% with VIX values already below 20. In fact, the median value for the VIX prior to the SPX drop is 31.21, again partly reflecting the clustering of volatility that results in multiple sharp drops in the SPX.

On average, a drop in the SPX of 3% or more translates to a 14.3% spike in the VIX. More than half of the time, the day of the SPX 3% drop turned out to be the high in the VIX over this 11 day period. On average, half of that spike is retraced within two trading days and over 70% of that move is retraced in five days.

In future posts, I will discuss in greater detail the issue of the VIX providing advance warning of a selloff in the broader market. Suffice it to say that while the graph above shows that the VIX does jump approximately 10% in the four days before a 3% SPX move, there is not the obvious telltale movement in the day or two before the selloff that might get the attention of the casual observer.

DISCLAIMER: "VIX®" is a trademark of Chicago Board Options Exchange, Incorporated. Chicago Board Options Exchange, Incorporated is not affiliated with this website or this website's owner's or operators. CBOE assumes no responsibility for the accuracy or completeness or any other aspect of any content posted on this website by its operator or any third party. All content on this site is provided for informational and entertainment purposes only and is not intended as advice to buy or sell any securities. Stocks are difficult to trade; options are even harder. When it comes to VIX derivatives, don't fall into the trap of thinking that just because you can ride a horse, you can ride an alligator. Please do your own homework and accept full responsibility for any investment decisions you make. No content on this site can be used for commercial purposes without the prior written permission of the author. Copyright © 2007-2023 Bill Luby. All rights reserved.
 
Web Analytics