Yesterday’s post on ETFreplay.com triggered so many favorable comments about this site and their graphics that it occurred to me I had neglected to mention that Livevol has added some new volatility skew graphics to Livevol Pro.
In the chart below, I have captured a snapshot of the implied volatility skew in USO, the crude oil ETF. With USO at just under 39 as I type this, the Livevol graphic captures the IV skew in the April (red line), May (yellow line), July (green line) and October (blue line) options. The April front month options have a steep smile, while the July options reflect the more classic flatter smile. Note that the May options look more like a smirk. I have not discussed volatility skew much to date, but I think it is time the blog dove into the Greeks, volatility skew and some more advanced options analytics, so this is definitely on my list of things to do going forward.
If anyone wishes to learn more about these skew graphics and get a better sense of how to interpret them, a good place to start is at the Livevol blog.
Finally, I can’t help but wonder whether I am the only one who thinks about the Aurora Borealis while looking at these skew charts…
For more on related subjects, readers are encouraged to check out:
- Livevol Pro: A World Class Suite of Volatility Tools
- ETFreplay.com Brings ETF, Volatility and Charts Together Under One Roof
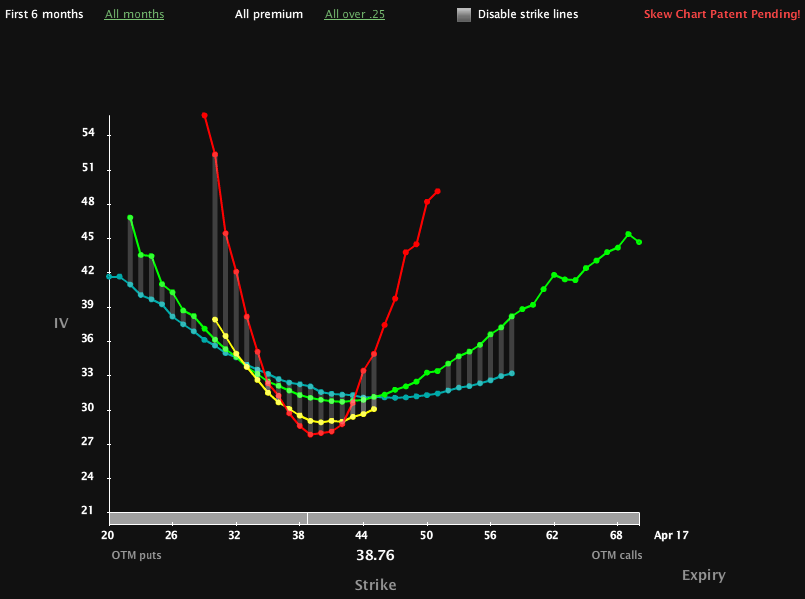
[source: Livevol Pro]
Disclosure(s): Livevol is an advertiser on VIX and More