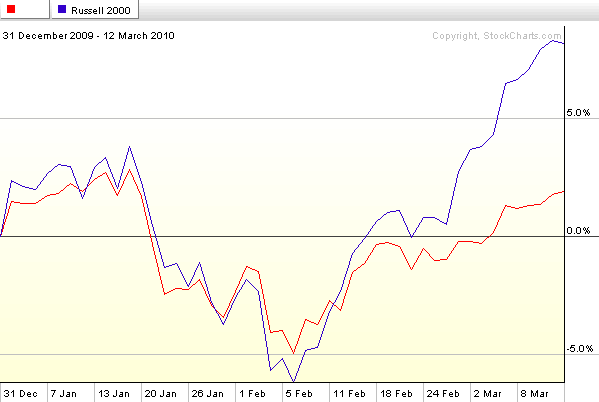
Among the many ways to evaluate the speculative activity in stocks is to evaluate the relative interest in small cap stocks versus blue chips. I like to do this by simply comparing the Russell 2000 index of small cap stocks (RUT) to the Dow Jones Industrial Average.
As the chart of the week below shows, for all of January and most of February, these two indices were tracking fairly closely. During the last two plus weeks, however, the Russell 2000 has begun to significantly outperform the other major market indices while the DJIA has been an underperformer in relative terms. As a result, RUT has begun to separate from the DJIA, indicating that investors are developing an appetite for riskier small cap stocks and are shying away from the safer blue-chip alternatives. A strong RUT relative to the DJIA typically means that the “risk trade” is in full gear and investors are comfortable placing more money in more speculative assets. As long as this trend continues, it is generally bullish for stocks as a whole.
For more on related subjects, readers are encouraged to check out:

[source: StockCharts]
Disclosure(s): none