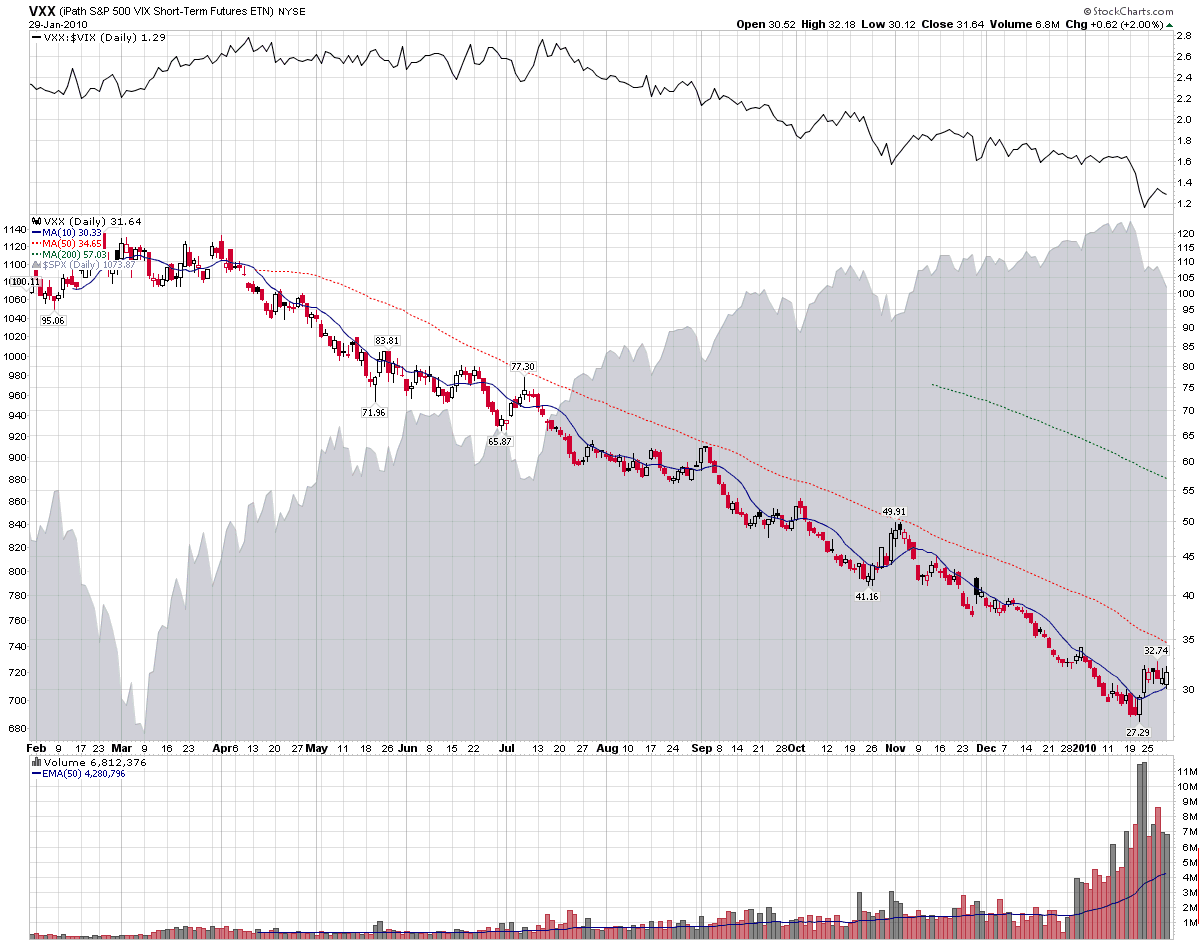
One year ago yesterday, the iPath S&P 500 VIX Short-Term Futures (1 month) ETN (VXX) was rolled out to little fanfare, with the exception of the widespread coverage that VXX and sibling VXZ received here when the ETNs were launched.
VXX opened at 100.11 that day, with the VIX at 42. 63. One year later, VXX is down 68.4% and the VIX is down 42.2%.
Setting aside leveraged ETFs, long positions in VXX were by far the best way to lose money in an ETF over the course of the last year. Putting the 68.4% loss in VXX in perspective, there were only two other ETFs in which investors could have lost 50% of their investment: short financials (SEF), which were down 52%; and short emerging markets (EUM), which fell 50%. Long natural gas (UNG) and short base metals (BOS) would both have resulted in losses of 48%.
This week’s chart of the week captures the VXX in all its futility, with a ratio of VXX to the VIX on top to see how VXX has underperformed the cash/spot volatility index throughout the past year.
The links below explain the manner in which negative roll yield and other factors have caused VXX to underperform the VIX and turn in such as disastrous performance. All things considered, I expect VXX to perform better relative to the VIX in its second year than it did in its first year, though admittedly this is not a very high bar to clear.
For more on how VXX is constructed and performs, readers are encouraged to check out:
- Why VXX Is Not a Good Short-Term or Long-Term Play
- VXX Calculations, VIX Futures and Time Decay
- Disappointment Lurks as Volume Surges in VXX
- Lost in Translation: VXX and VXZ
- Chart of the Week: VXX Volume Surges

[source: StockCharts]
Disclosures: short VXX at time of writing
Glad to see you're short VXX!! Great call.
ReplyDeleteShort VXX is the way to play this baby. Nice ride since Friday afternoon!
ReplyDelete