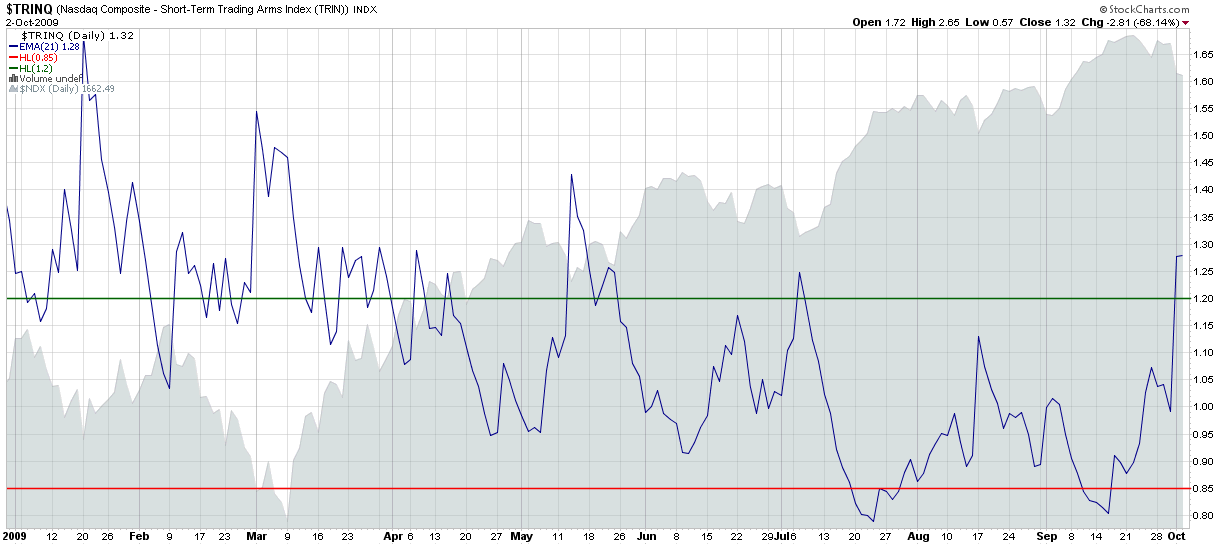
The NASDAQ TRIN is an indicator I generally hear very little about, yet in a market where technology stocks have been leading many of the advances and decline, one that I believes deserves closer scrutiny.
In this week's chart of the week below, I show a simple NASDAQ TRIN chart that uses a 21 day exponential moving average to smooth out some of the daily noise that is common in short-term studies of this indicator. As a contrarian market sentiment indicator, the TRIN is useful for helping to identify market turning points or the potential for near-term reversals.
The chart below shows that since the markets settled down and bottomed in early March, the NASDAQ TRIN has been adept at signaling buying points (below the green horizontal line) and selling points (above the red horizontal line.) Friday’s EMA-smoothed reading of 1.28 is the highest since the mid-May bottom and suggests that the current pullback may be another good buying opportunity.
Whether or not you agree with the buy on the dip approach at the moment, you should make an effort to keep an eye on the NYSE TRIN (a.k.a. the Arms Index) and the NASDAQ TRIN as market timing signals.
For additional reading on the TRIN and the NASDAQ TRIN, readers are encouraged to check out:

[source: StockCharts]