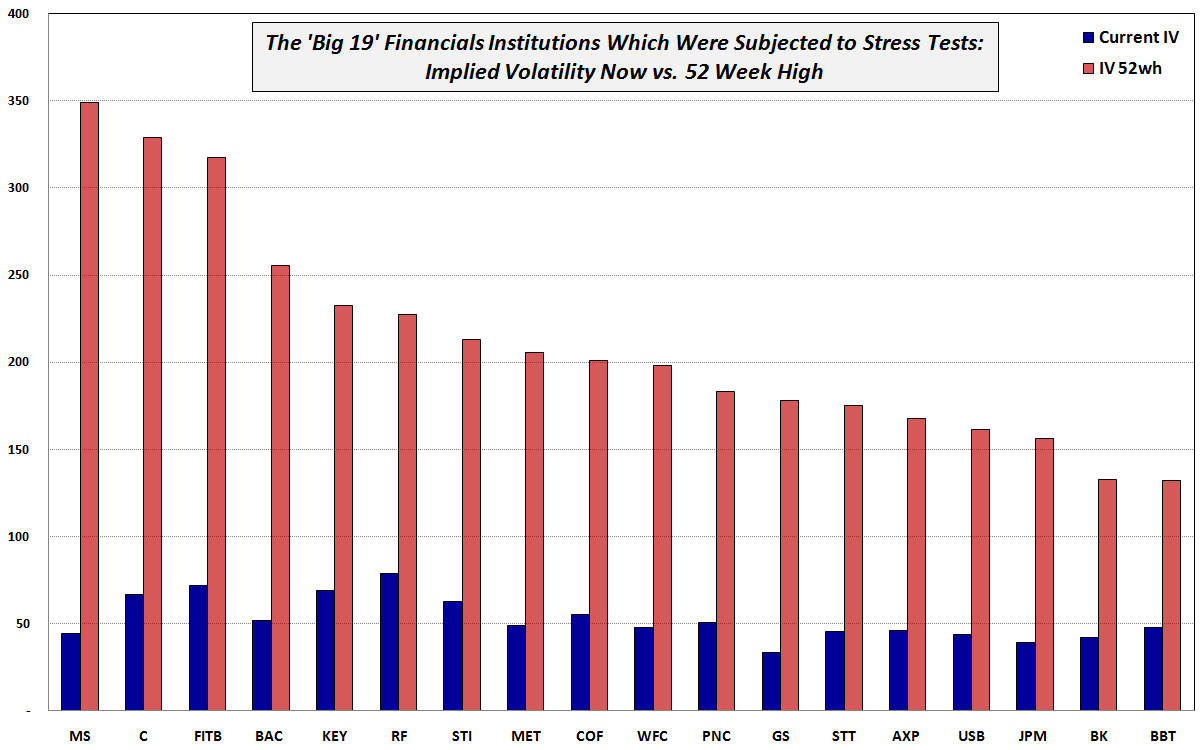
Sunday’s chart of the week, which looked at Implied Volatility of DJIA Components: Now vs. 52 Week High, received enough interest to warrant a follow-up that examines the current implied volatility vs. the 52 week high IV of the 19 financial institutions which were subjected to the government stress tests. [link to stress test results]
The chart below sorts the financial institutions from left to right according to their 52 week implied volatility highs, with GM omitted. While not captured in the graphic, I find it interesting that the two institutions whose current IV is the lowest compared to the high IV are Morgan Stanley (MS) at 12.7% of the 52 week high and Goldman Sachs (GS) at 18.9% of the 52 week high. Those institutions whose current IV is closest to the 52 week high (in percentage terms) are BB&T (BBT) at 36.3% and Regions Financial (RF) at 34.6%.
So…going solely on the percentage retracement from implied volatility highs, it appears as if the investment banks are healthiest and have shed the most risk, while regional banks have undergone a much more measured healing process – about what one might expect. Clearly this is a story of multiple different pathways back to financial health.
[source: International Stock Exchange]
Bill, on another matter - $VIX:$VXV has been dancing under 0.90 for some time. Any thoughts? Thanks
ReplyDeleteThe S&P 500 index increased seven of the past eight trading sessions and it closed near the top of its Bollinger band while forming a gravestone doji and the Nasdaq increased nine consecutive days. The possibility of a short-term decline before the Dow exceeds 10000 exists.
ReplyDelete