The VIX closed at 26.36 today, down 15.4% from Monday’s close of 31.17 to the lowest closing level since the 25.66 close on September 12, 2008 – the last trading day before the Lehman Brothers bankruptcy was announced.
According to the classic 10 day simple moving average measure, which has the VIX currently sitting 11.7% below that level, the VIX is now in an ‘oversold’ position according to the TradingMarkets 5% Rule as well as a more stringent 10% threshold used by other traders.
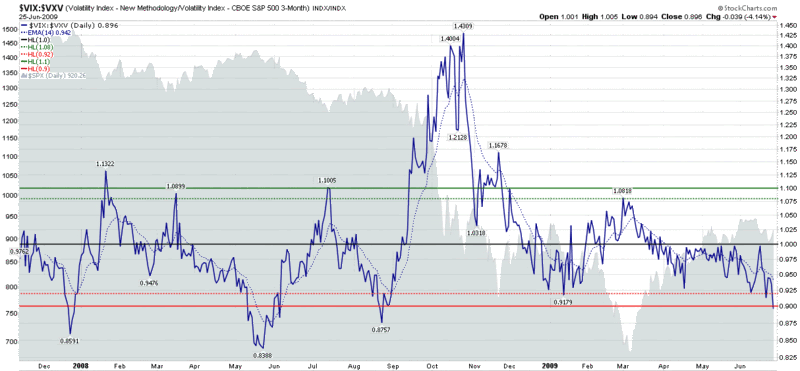
From a volatility term structure perspective, the VIX is also oversold. Notably, the VIX:VXV ratio, which compares 30-day volatility of SPX options to 93-day volatility (using the VXV index), closed today at 0.896 today. In the chart below, you can see that when this ratio closes at 0.92 or below, the bears tend to have an upper hand for at least several weeks. When the ratio drops below 0.90, as was the case today, the odds shift even more favorably in the direction of the bears.
In brief, the low current levels in the VIX:VXV ratio suggest that options traders are too bullish and complacent in their 30 day outlook (event volatility) relative to their 93 day outlook (structural volatility.) While these two volatility measures can be brought back into line by lowering estimates of long-term structural volatility, the path of least resistance is for short-term event volatility to rise. This means the odds favor that the VIX will move in the direction of the VXV, which closed at 29.41 today. Of course rising volatility tends to favor the bears at the expense of the bulls. Even with today’s exceptionally strong close, longs should consider taking profits and/or initiating short positions.
[source: StockCharts]
Disclosure: Long VIX at time of writing.
Would you consider the fact that we are not at a new price high as this ratio is reaching a sell point as a possible indicator of the size of the bear's "upper hand"? Or is there no evidence that the two (price high/ratio low) need to coincide? Eyeballing your chart, it looks like they tend to, or at least be pretty closely tied.
ReplyDeleteIf this model works out this time, it would be really close to a really good market-timing tool. Such a thing should not exist...
ReplyDeleteBill
ReplyDeleteWould you recommend a way of being able to model an approximation for VIX v VXV that would date back before the start of the VXV?
e.g. a comparison of shorter term historical volatility with longer term historical volatility?
Douglas
Just one thought though, take look at ISEE, is fairly bearish though. We rarely close below 100 and look at all indicies/etf is only at 30s which means super bearish. So could retail option player be right this time?
ReplyDeleteStefan
ReplyDeleteAre you suggesting that if this works...then it will stop working?
Douglas
Bill, I've kept my own chart on this ever since you shared the idea. My review suggests that the sell signals, such as today, tend to be a few days early wrt SPY price top.
ReplyDeleteOn that basis, I'm expecting an end of quarter markup, then the drop.
Thanks for all the comments, everyone. They are coming in faster than I can compose a reply...
ReplyDeleteAn excellent question about SPX highs, Anon. In the past, a close below 0.9 has tended to either follow a recent top in the SPX and/or precede a lower bottom in the VIX:VXV ratio, so while I would be hard pressed to come up with some hard data to confirm your hypothesis, I like where you are going with it and would expect that it has at least some merit.
Stefan, I agree that this will be an interesting test of the model and if it holds up, maybe I should just delete the blog and go raise some money... :)
Douglas, VXX:VXZ works for these purposes as well (though you have an even smaller historical data set -- unless the ETF sponsors care to help you out.) Alternatively, you could look at front month VIX futures vs. futures 3-4 months out. Here you have a wealth of historical data available.
Cheers,
-Bill
Looking at this ratio on a candlestick chart, I see that yesterday and today both form candles looking (somewhat) like a bearish engulfing pattern. It suggests to me that we might see a lower ratio in the very short term before going up. I'd love to be wrong, as I'm already short.
ReplyDeleteReally amazing post.....could this mean that inverted calendars are smart in this market? Long short term options and short long term options?
ReplyDeleteHi Bill-- well my memory is that I last left a comment on this site around the March lows, which you *pretty much* called, I do believe. At the time I said that I was going long, and it worked out well.
ReplyDeleteJust for the record, I've seen enough: several things I watch are showing signals (2-4 month timeframe) + on the macro side deflation ain't over + your chart this AM speaks volumes.
I'm about to leg into some SH. Right or wrong, thanks as always for your lucidity Bill. --T
Tim,
ReplyDeleteWhile I don't trade short/inverted calendar spreads, the current environment could be a good setup for such a trade.
Tom,
Thanks. The deflation story is one that intrigues me. I've gone back and forth on that a couple of times already.
As for being wrong, if I'm going to be wrong, I guess I might as well be lucid about it!
Cheers,
-Bill
Hey Bill,
ReplyDeleteI agree in that the $SPX, $DJI and $RUT are all flashing the warning bell...but got any idea why the dang Nasdaq is so strong? AAPL maybe?
Cheers
the bubble was in the financial not in techs. like-wise, in year 2000, it was tech that was a bubble. the nasdaq and dow/sp500 are both reverting closer back to their mean. techs will go down with the dow/sp500 soon but they just switched position from the last bubble since the 2007 top.
ReplyDeleteJimmy
the bubble was in the financial not in techs. like-wise, in year 2000, it was tech that was a bubble. the nasdaq and dow/sp500 are both reverting closer back to their mean. techs will go down with the dow/sp500 soon but they just switched position from the last bubble since the 2007 top. Jimmy
ReplyDeleteGreat analysis! While market signals like the VIX:VXV ratio are critical for investors, I’ve been diversifying my portfolio beyond stocks. Real estate, especially New Flats in Noida, has caught my eye recently for its promising growth potential. It’s always good to explore stable long-term investments!
ReplyDelete