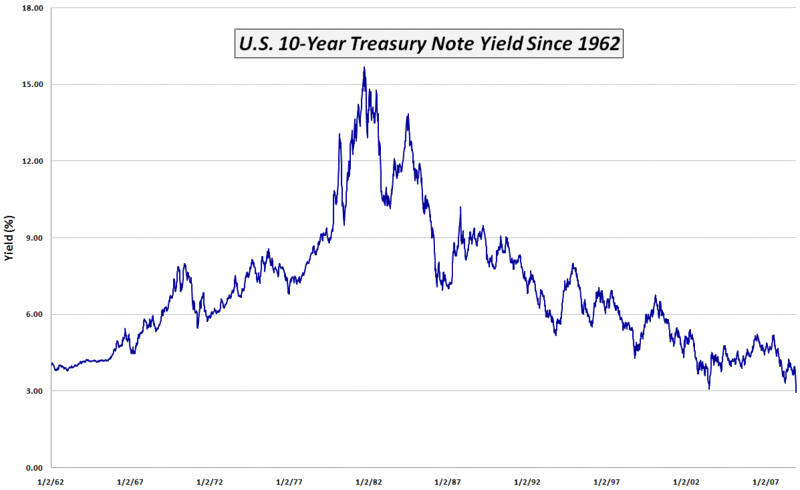
The
chart of the week looks like it will now be a regular feature in this space. This week’s theme, once again, has a bond focus and extends the flight to safety theme from
last week. The graphic below captures the full 46 year history of the yield on the
10-Year U.S. Treasury Note. While difficult to discern from the graph, this is the first week the yield on that bond has ever closed below 3.0%. The reason for the low yield is the overwhelming demand cause by investors who are embracing a flight to safety approach to investing and see U.S. government debt as a safe haven for their assets.
The low yields on U.S. government debt have several interesting implications. One implication is that a falling VIX does not reflect the action in the government bond markets. Another implication is that rising yields will indicate when money is starting to flow out of safe haven investments toward higher risk investments such as stocks. Finally, when the bulk of those currently holding government debt decide that it is appropriate to redeploy these assets into stocks, the pent-up demand for equities will be a formidable factor to reckon with.
[source: VIX and More]
Since quantitative easing means collapsing term premiums of unknown extent, long note and bond positions taken in anticipation of trading gains represent risk preference rather than aversion.
ReplyDeleteNice write up. Check out my post at this link: http://thetechnicaltakedotcom.blogspot.com/
ReplyDeletethanks and good luck