India has an India VIX, Germany has the VDAX, and some other countries (largely in Europe) have their own country volatility indices. Outside of North America and Europe, the volatility index pickings are slim, however, so when you want to get a sense of international volatility on a broader scale, you have to roll your own.
Which is exactly what I have done today.
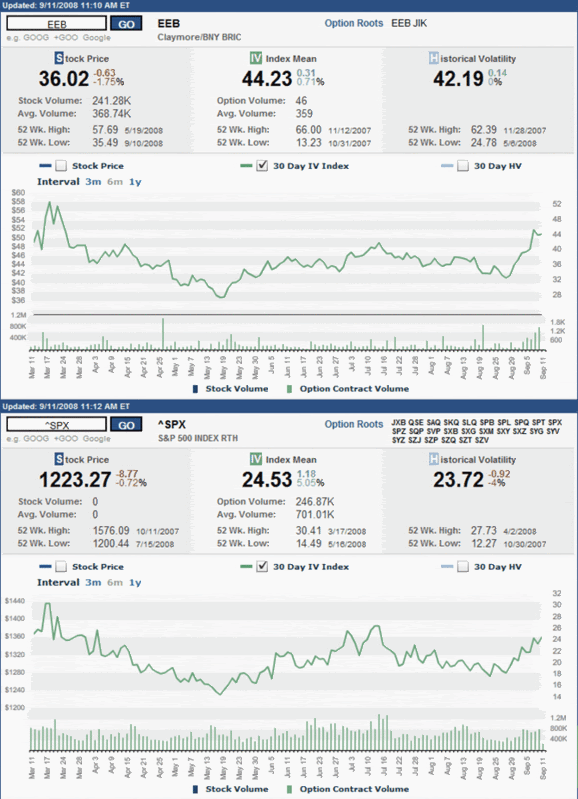
In the chart below, the bottom half is a six month chart of implied volatility in the S&P 500 index. It is similar, but not identical to the VIX. Note the March high, a second peak in mid-July, and the recent uptrend in volatility.
On the top half of the chart is the implied volatility in the Claymore BHY BRIC (Brazil, Russia, India, and China) ETF (EEB), which attempts to replicate the performance of the Bank of New York BRIC Select ADR index. In contrast to the SPX, implied volatility in the BRIC ETF was relatively moderate in July, but has spiked dramatically over the course of the past two weeks. In short, fear and anxiety may be rising slowly in U.S. markets, but in the critical economies of Brazil, Russia, India, and China, signs of panic are much more widespread.
If emerging markets are the buffer whose continued growth is supposed to buttress developed markets in this economic slowdown, then emerging markets need to find their own firm ground and soothe anxious investors before they can be expected to lubricate the wheels of the global economy.

[source: International Securites Exchange]
I wonder how much of the BRIC volatility spike maybe attributable to the incredible volatility in the RUSSIAN markets recently ?
ReplyDeletethere has been a rumor about asian markets meltdown due to the global slowdown. what a hoax it was. nothing really bad happened. in fact some asian markets r forming a bottom now.
ReplyDeleteHi Kaiser,
ReplyDeleteWith IV at a new high for 2008, Russia has definitely been a significant contributor to the volatility of the BRIC ETF in the past two weeks.
Brazil's IV is down from levels seen earlier in the year, but has jumped sharply in the past two weeks. The same can be said for China, where IV is also ramping up.
IV in India has been the most stable of the four as of late.
Stonebat,
Things looked ugly in South Korea and Thailand (among other countries) for awhile and have stabilized for the moment, but I'm not sure I'd be ready to call a bottom with any confidence, as quite a few Asian markets are sitting on 52 week lows.
Cheers and thanks for the comments,
-Bill
Bill - could you talk a bit more about how you constructed the volatility index for the ETF?
ReplyDeleteHi Damian,
ReplyDeleteThe volatility indices for the EEB and SPX are implied volatility calculations generated by the ISE. My role was limited to selecting the relevant securities and time frame, as well as stripping out the price and historical volatility data.
I hope this helps.
Cheers,
-Bill
Bill- I really like your Brazil post (nearing a bottom) and the differentiation between BRIC and US Vix is important for global invesotrs to learn about. We would love to see more of your work on our South American Stocks blog.
ReplyDeleteHaving personally toured many of the hotspots for investement opps (chile/Brazil/Peru)- you are right on the money- and the market seems to agree. The last three days have been HOT-HOT-HOT.
Thanks,
Jon