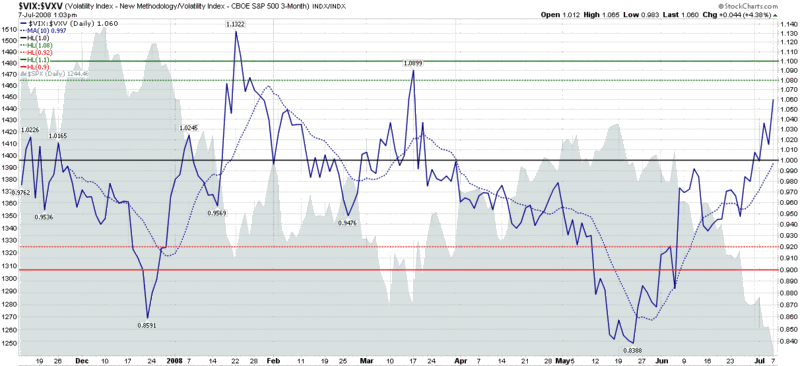
One of the better indicators over the past 7 ½ months has been the VIX:VXV ratio, which, as the chart below shows, has been quite accurate in calling tops and bottoms in the market following the VXV launch back in November 2007 and I whose application I pioneered soon thereafter. I mention this because the last time the VIX:VXV ratio gave a clear bullish signal was at the mid-March bottom; and the ratio is coming close to another VIX:VXV bullish signal today.
For more information on the VIX:VXV ratio, try The VIX, VXV and Volatility Expectations. For more information about the VXV, try Thinking About the VXV.
Bill, curious that i got the ratio of 1.042 at stockcharts.com (yes i did the same $vix:$vxv for the sharpchart.) anything different from yours that i need to know???
ReplyDeletethanks in advance, and yours and Quantifiable Edges are my two favorite stock market blogs.
Jimmy
Maybe time
ReplyDeleteBill's Charts: 07-Jul-2008 01:03pm
Close 07-Jul-2008: 1,04
Looks like a timing issue.
ReplyDeleteI show a high of 1.0626 yesterday -- and a low of 1.0222 earlier in the day.
As of this morning (Tuesday), the ratio appears to be hovering around 1.04.