It is that time of year where investors look back at 2009 and ahead toward 2010.
In looking back at 2009, investors who were fortunate enough to time the March bottom have been able to take advantage of most or all of 68% gain in the S&P 500 index since that bottom. While stocks have been on a tear for the past 9 ½ months, I would hazard to guess that quite a few investors do not realize that for the most part, junk bonds have performed as well as equities during this period.
In this week’s chart of the week, below, I show the almost identical performance of SPY (SPDR S&P 500 ETF) and JNK, a junk bond ETF formally known as the SPDR Barclays Capital High Yield Bond ETF (holdings). Amazingly, since the March 9th bottom in stocks, JNK has matched SPY step for step – and with less volatility.
If the U.S. economy continues to rebound in 2010, it is possible that junk bond ETFs such as JNK and HYG will keep pace with stocks going forward. At the very least, these ETFs offer investors some portfolio diversification and less volatility – even though these are an extremely risky asset class.
For more on related subjects, readers are encouraged to check out:
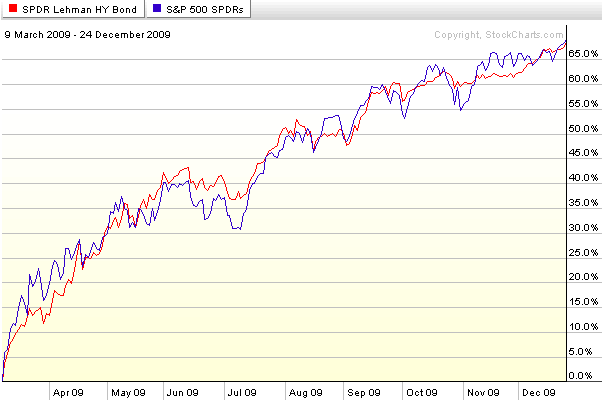
[source: StockCharts]
Disclosure: none