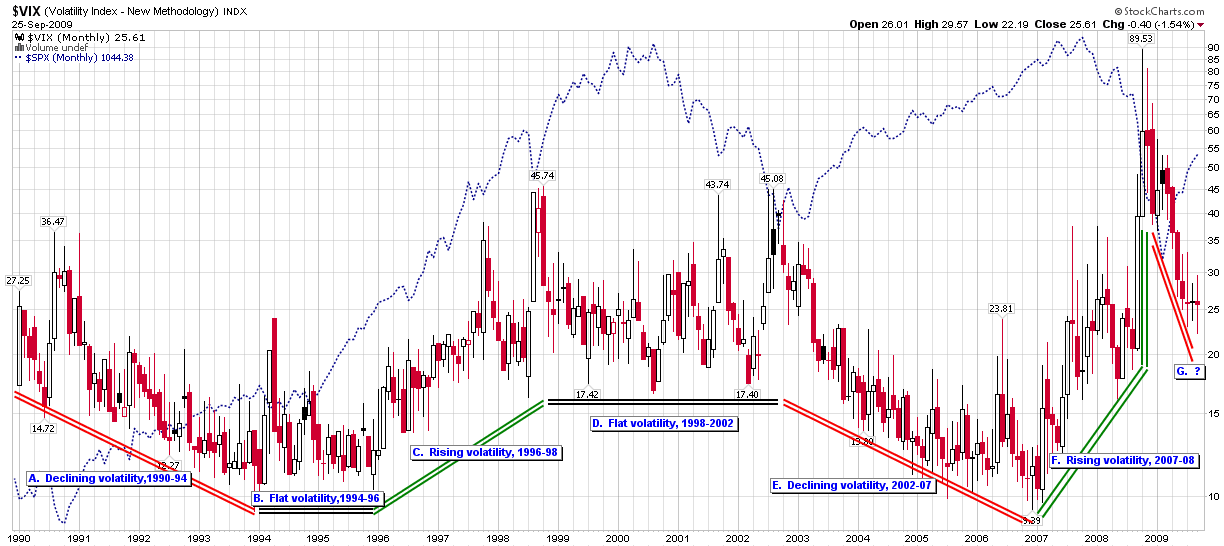
The last time I updated my as VIX macro cycle chart, a little more than five months ago, the VIX had just dipped below 40.00 and I was looking at a bottom as low as 25.00 or so. For awhile, the area around 24.00 offered significant support, but with Wednesday’s low of 22.19, it is time to formally update my thinking about a new floor in the VIX and to place the current declining volatility environment in the context the two decades of VIX historical data.
This week's chart of the week below shows seven different VIX macro cycles, typically of 2-4 years in duration, dating back to the 1990 historical reconstructions of VIX data. The chart highlights just how extreme and unusual the VIX spikes and persistent high volatility was during the latter part of 2008 and the first few months of 2009. I find it interesting that this monthly chart shows three consecutive months of doji candlestick patterns with almost identical real bodies – meaning that despite the wide ranges during the month, for the last three months the opening and closing values of the VIX were very similar.
Note also that during the one previous instance of extended high volatility, from 1998 to 2003, strong support was found in the 20-22 range.
In fact, the lifetime average (mean) of the VIX since 1990 stands at 20.25, while the 10-year average is 22.11.
For these and other reasons, I expect that the 21.50-22.00 level will hold up as a VIX floor at least through the end of the calendar year.
Similarly, the most recent VIX macro cycle, which began in December 2008 and consisted of a period of declining volatility, may already have ended and is almost certain to be over by the end of the year.
For additional posts on VIX macro cycles, readers are encouraged to check out:
- The New VIX Macro Cycle Picture (4/23/09)
- Recent Volatility and VIX Macro Cycles (10/30/08)
- VIX Macro Cycle Update (3/19/08)
- Was 2007 the Beginning of a New Era in Volatility? (12/24/07)
- VIX Macro Cycles (9/10/07)

[source: StockCharts]
If the vix is range bound b/t 22-30, what do you think about selling strangles on this range?
ReplyDeleteI think the assumption of a range-bound VIX in the 22-30 range is a good one and I like the idea of selling strangles to take advantage of this.
ReplyDeleteCheers,
-Bill
As I wrote this the VIX has dropped to 21.73 and should the S&P 500 continue to rise -- which it very well might -- the VIX will break right below 20.
ReplyDelete