Tuesday I went the analogy route in Thinking About the New VIX ETNs. Today I thought I should try the direct route and show a graph of the difference between the cash/spot VIX and the VIX futures five months out.
Keep in mind that the Barclays VIX ETNs, which are scheduled to begin trading tomorrow, target constant weighted average futures maturities of one month (VXX) and five months (VXY). The methodology used to achieve the constant maturity involves the blending of different proportions of various futures maturities each day. The chart below is slightly different in that it utilizes VIX futures with five months to maturity, but only rolls the contract out once per month. Nevertheless, it provides a very good approximation of the difference between the cash/spot VIX and the VIX futures with five months to maturity. Apart from confirming the large difference between current volatility expectations and expectations 5 month out, the peaks and particularly the valleys in the differential between the VIX and VIX five month futures show a high degree of correlation to the peaks and valleys in the SPX during the same period.
Something to think about, anyway, as the VIX ETNs near the starting gate.
And yes, these principles are similar to what I have talked about at some length with respect to the VIX:VXV ratio. For the record, the VIX:VXV ratio sits at 0.976 as I type this, slightly bearish, but consistent with the tight range this ratio has been in over the course of the past month.
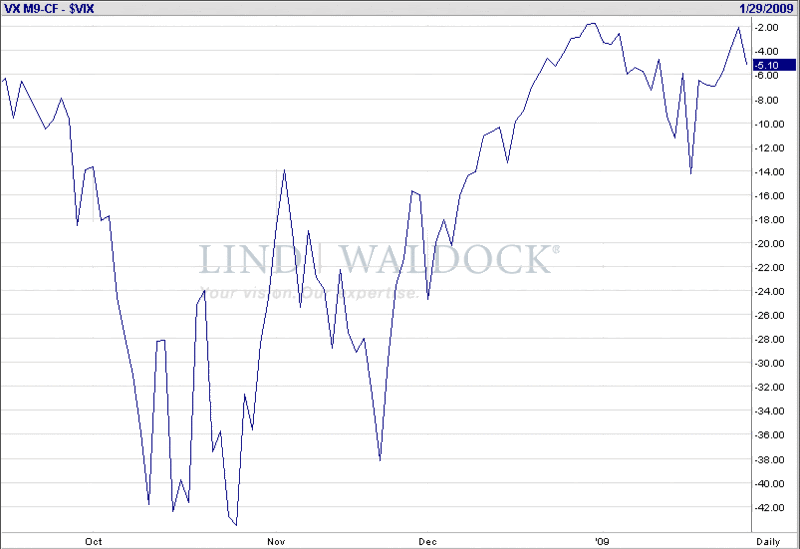
[source: FutureSource.com]
For some additional perspective on the new VIX ETNs, check out:
- Should You Trade the VIX ETNs (Condor Options)
- VIX ETN Not a Wild Enough Ride (Jim Wiandt, IndexUniverse)
- Gimme Some ETNs (Daily Options Report)
- Barclays Readying ETNs Tied to VIX Futures (John Spence, MarketWatch)
…and for those who may have missed it, I published some initial thoughts on VIX ETNs from the top bloggers over the weekend in Barclays VIX ETNs Slated to Begin Trading on Friday.
0 comments:
Post a Comment