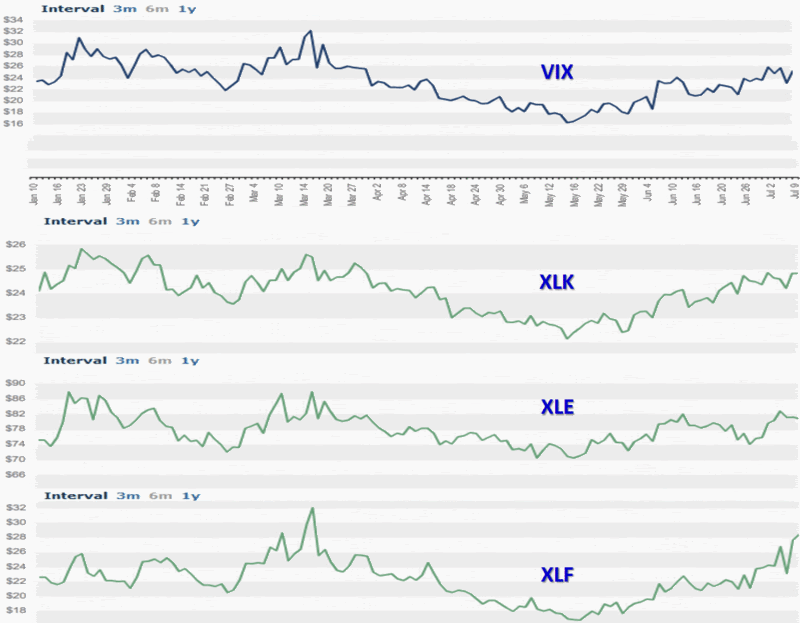
Yesterday, in The Impact of Financial and Energy Stocks on the VIX, I talked about the low (and sometimes negative) correlation between the SPX and some of the sectors represented in the index.
Today I am posting a graphic of the top three sectors (per the Sector SPDR breakdown) in the SPX: technology (XLK: 19.7%); energy (XLE: 15.3%); and financials (XLF: 14.2%). The graph shows a strong correlation between the implied volatility of the SPDR sectors. This should come as no surprise.
Some readers have expressed confusion about correlations between prices and implied volatility. The key takeaway is that SPX implied volatility is not cumulative. The net implied volatility of the SPX is a function of not just the implied volatility of the components or sectors, but also of the directional pull. Let’s take a simplified example. Consider a hypothetical situation in which XLK and XLE are both 18% of the total SPX and both have an implied volatility of 40. If both are perfectly correlated, then 36% of the SPX should have an implied volatility of 40. If, on the other hand, XLK has a correlation of +1.0 (100% positive correlation) and XLE has a correlation of -1.0 (100% negative correlation), then the two sectors cancel each other out and the ‘net implied volatility’ for this 36% slice of the SPX is an even zero.
As a general rule, the higher the correlation among the sectors and individual stocks, the higher the net implied volatility. High implied volatility combined with low or negative correlations generally translates into lower net implied volatility.
For some more detailed individual research into this topic, I recommend Don Fishback’s Index Implied Volatility Is Based on Correlation and Time – It’s Not Just Magnitude!

0 comments:
Post a Comment