In this week’s chart of the week, I wish simply to make two points:
- If you are focusing your investments in U.S. stocks, you are likely underperforming 80% of the global investment world so far in 2009
- FINVIZ.com has some excellent summary graphics for geographical and sector/industry group performance and other metrics
The chart below is one such example.
The quick takeaway? Get global!
For some related posts, try:
- Chart of the Week: Breaking Down the S&P 500 Index in Q2
- Equities or Commodities?
- Short Covering Driving Today’s Gains
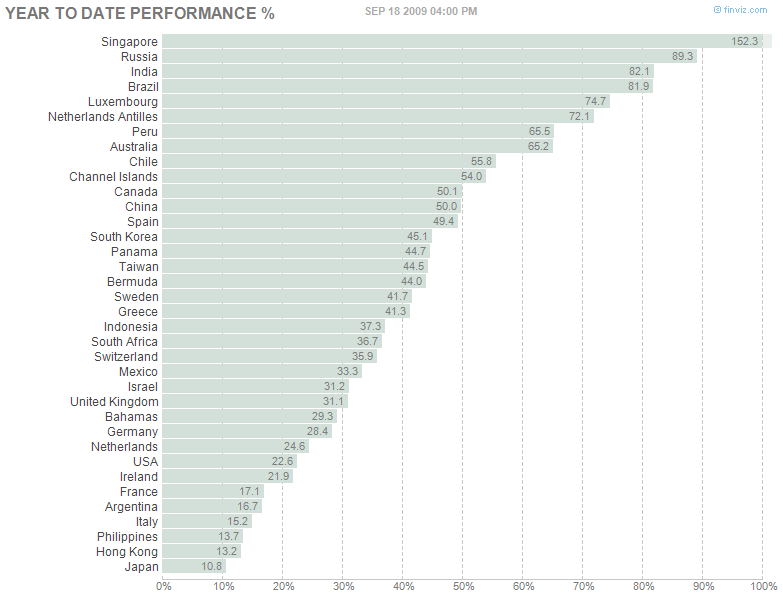
[souce: FINVIZ.com]
some info is incorrect
ReplyDeleteI am in agreement, anon, and am wondering if FINVIZ is getting this from ETFs instead of local indices.
ReplyDeleteNow that I study this, some of the numbers are a mystery...
Cheers,
-Bill
Would be interesting to see the 2008 chart...doubt it would be so appetizing...I guess as usual timing is crucial
ReplyDeleteThe benchmark S&P 500 index is up almost sixty-one percent since its March ninth low and the VIX index closed just 0.6 points above its fifty-two week low of 22.48. Dow 10000 is just 170 points away and a ten percent correction in the SPX 500 index has not occurred in over six months. The U.S. stock markets have performed well over this time frame and the commodity-based Canadian, Australian and Brazilian markets have performed even better.
ReplyDeleteThere are other examples of a mysterious (wrong? inaccurate?) Finviz stock chart:
ReplyDeletealltimehighstocks...\inconsistent-stock-charts