I am surprised by how many traders, bloggers, and hybrids (a category I seem to have morphed into) are content to stick with the default settings offered by their favorite charting package. On a related note, one reader had asked me why I stick to the 10/50/200 simple moving averages on most of my charts; another reader regularly decries the laziness of the default charting crowd, adding that they deserve the mediocre performance that their lack of curiosity and imagination undoubtedly lead to.
So consider this the first post in my evangelical crusade against rampant defaultism.
Let’s start with simple moving averages. Personally, I prefer my standard chart of daily bars to have SMA settings of 16, 38 and 155 days. That is not much different from the 20/50/200 setting that is favored by many charting packages, but it works for me and it gives me a slightly different perspective on the world, which often makes it easier to take a position against the crowd. Of course, I have different settings for looking at narrower or broader time frames.
Moving on to an example, Bollinger Bands is one of the indicators for which I rarely see anything other than the default settings of 20 days and 2 standard deviations. Why is this? Is it laziness? Is the indicator so perfectly constructed as to defy tweaking? Is it possible that 20 days and 2 standard deviations work that well over all time horizons? Hardly. Read Bollinger on Bollinger Bands to see what John Bollinger has to say on the subject or do some experimenting on your own without the safety net of Bollinger’s commentary (for more information on Bollinger Bands, check out John Bollinger’s Bollinger Bands web site.)
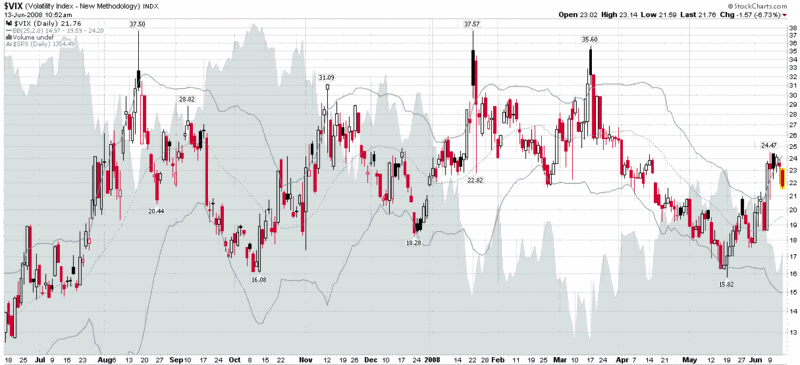
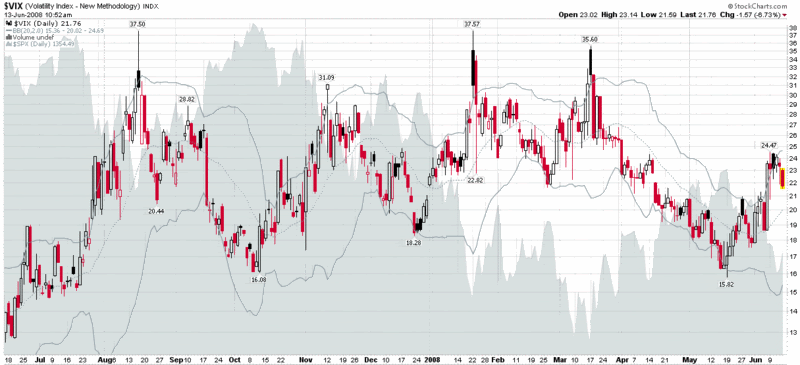
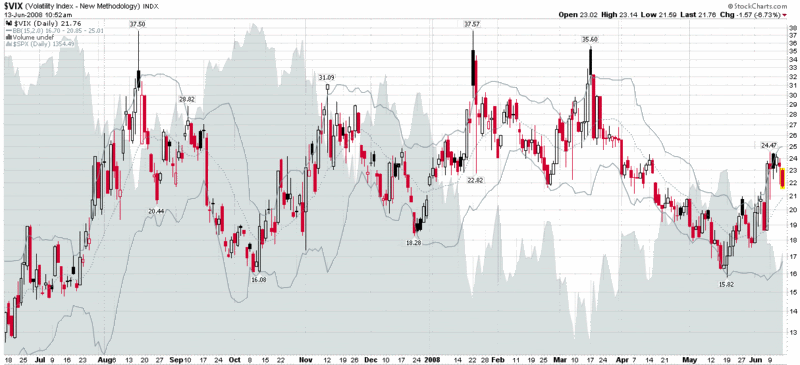
In the three charts below, I have modified the Bollinger Bands setting to reflect a 25, 20, and 15 day setting – while keeping (at least for today) the 2 standard deviation parameter intact. Without providing too much commentary, note that in the top chart, the 25 day setting casts what I call a longer ‘time shadow’ to the right of any major moves. This time shadow is muted somewhat in the second chart (20 days) and is even less noticeable in the bottom chart (15 days). Note also how the 25 day setting almost resembles Donchian Channels (aka price channels), while the 15 day setting hugs the price action closely enough so that even a gentle trend can exceed the standard deviation bands. Consider, for a minute, the possible implications of customizing Bollinger Bands for securities that have a greater tendency to trend (i.e. commodities) vs. those that have more pronounced mean-reverting characteristics, like the VIX.


great post. One has to be wary of curve fitting obviously when tweaking things but there are clear edges that exist over finite time periods by tweaking and I suspect most of it has to do with trading against and taking advantage of those using the defalts... A phase shift of sorts.
ReplyDeletePerhaps there is a logic to using the standard 50/100/200 SMA or whatever.
ReplyDeleteIf a large number of people are using the same coefficients, then they will also be looking at the same entry/exit/stop points.
If you want to catch a fish...think like a fish.
Marc
Alan Farley uses 13 for his intra-day BB setting, with 8 and 5 period Exponential moving averages
ReplyDeleteThese are Fib Numbers FWIW
Love the blog
Mike