The inverted VIX was such a big hit in its debut that I thought I maybe we should cut one more album, then go on tour, perhaps somewhere that we can get paid in euros…
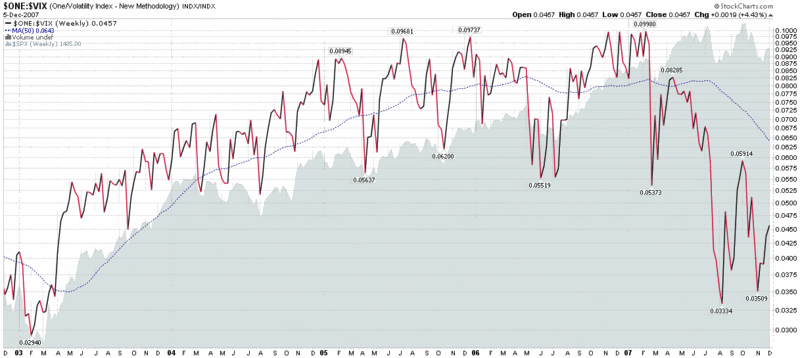
For those that haven’t bothered to click through one of the links above, the inverted VIX chart below is generated by calculating the inverse of the VIX (1/VIX in mathematical terms) so that it can be plotted in such a manner that VIX tops tend to coincide with market tops and VIX bottoms with market bottoms. For fun, I have added a 50 week SMA to the weekly chart of the inverted VIX, along with an area chart of the SPX.
The result, particularly when looking at the current value of the inverted VIX relative to the 50 week SMA, suggests a market that has just begun to rebound and still has a long way to go before it starts to get overbought.
To be fair, if this turns out to be the beginning of a bear market, neither the VIX nor the inverted VIX is likely to be a particularly helpful intermediate or long-term timing tool, as a graph of the inverse VIX during the 2000-2003 bear market demonstrates. Until we start making lower highs and lower lows in the broader indices, however, the VIX will continue to be a helpful tool for determining when to buy on the dips.

0 comments:
Post a Comment