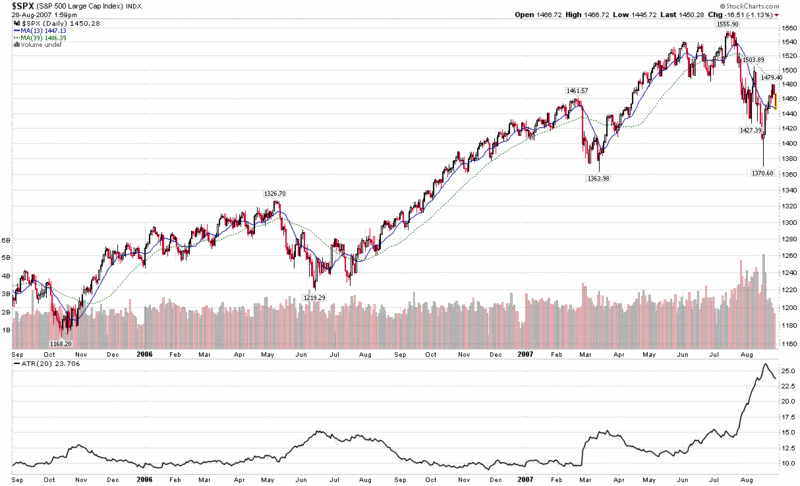
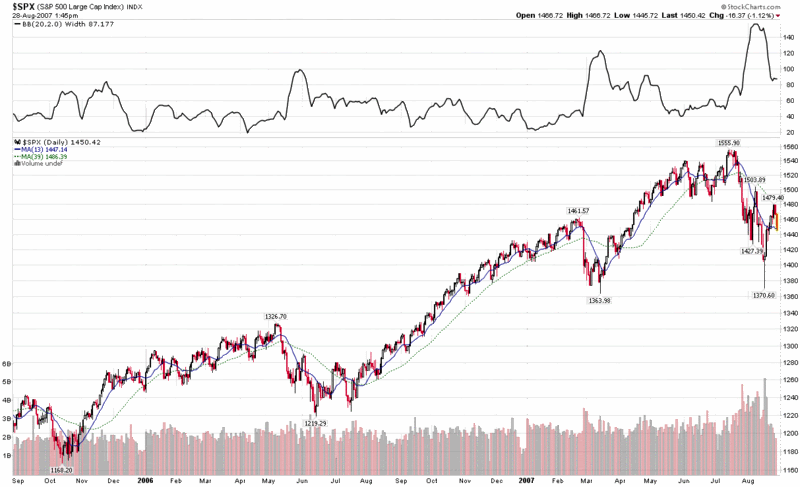
 Hans Wagner (not pictured) has an article with the title “Volatility as a Stock Market Indicator” up on Financial Sense. Posted yesterday, the Wagner article examines the relationship between volatility and market performance from a monthly and yearly perspective. In his analysis, Wagner leans heavily on the research of Ed Easterling of Crestmont Research, whose relevant book, Unexpected Returns: Understanding Secular Stock Market Cycles, I confess not to have read.
 Using S&P 500 index data going back to 1962, Easterling notes that when the average daily range (in percentage terms) of the S&P 500 is lowest, it corresponds to a higher likelihood of monthly gains in the index. So…calmer waters make for easier sailing.
A quick and dirty way to monitor these types of opportunities is with a 20 day Average True Range or 20 day Bollinger Band width indicator. As you can see from the charts below, both ATR and BB width provide an excellent means by which to evaluate market volatility graphically, with fairly reliable and easily measurable signals of volatility extremes, not unlike the information provided by the VIX.


0 comments:
Post a Comment